Overview
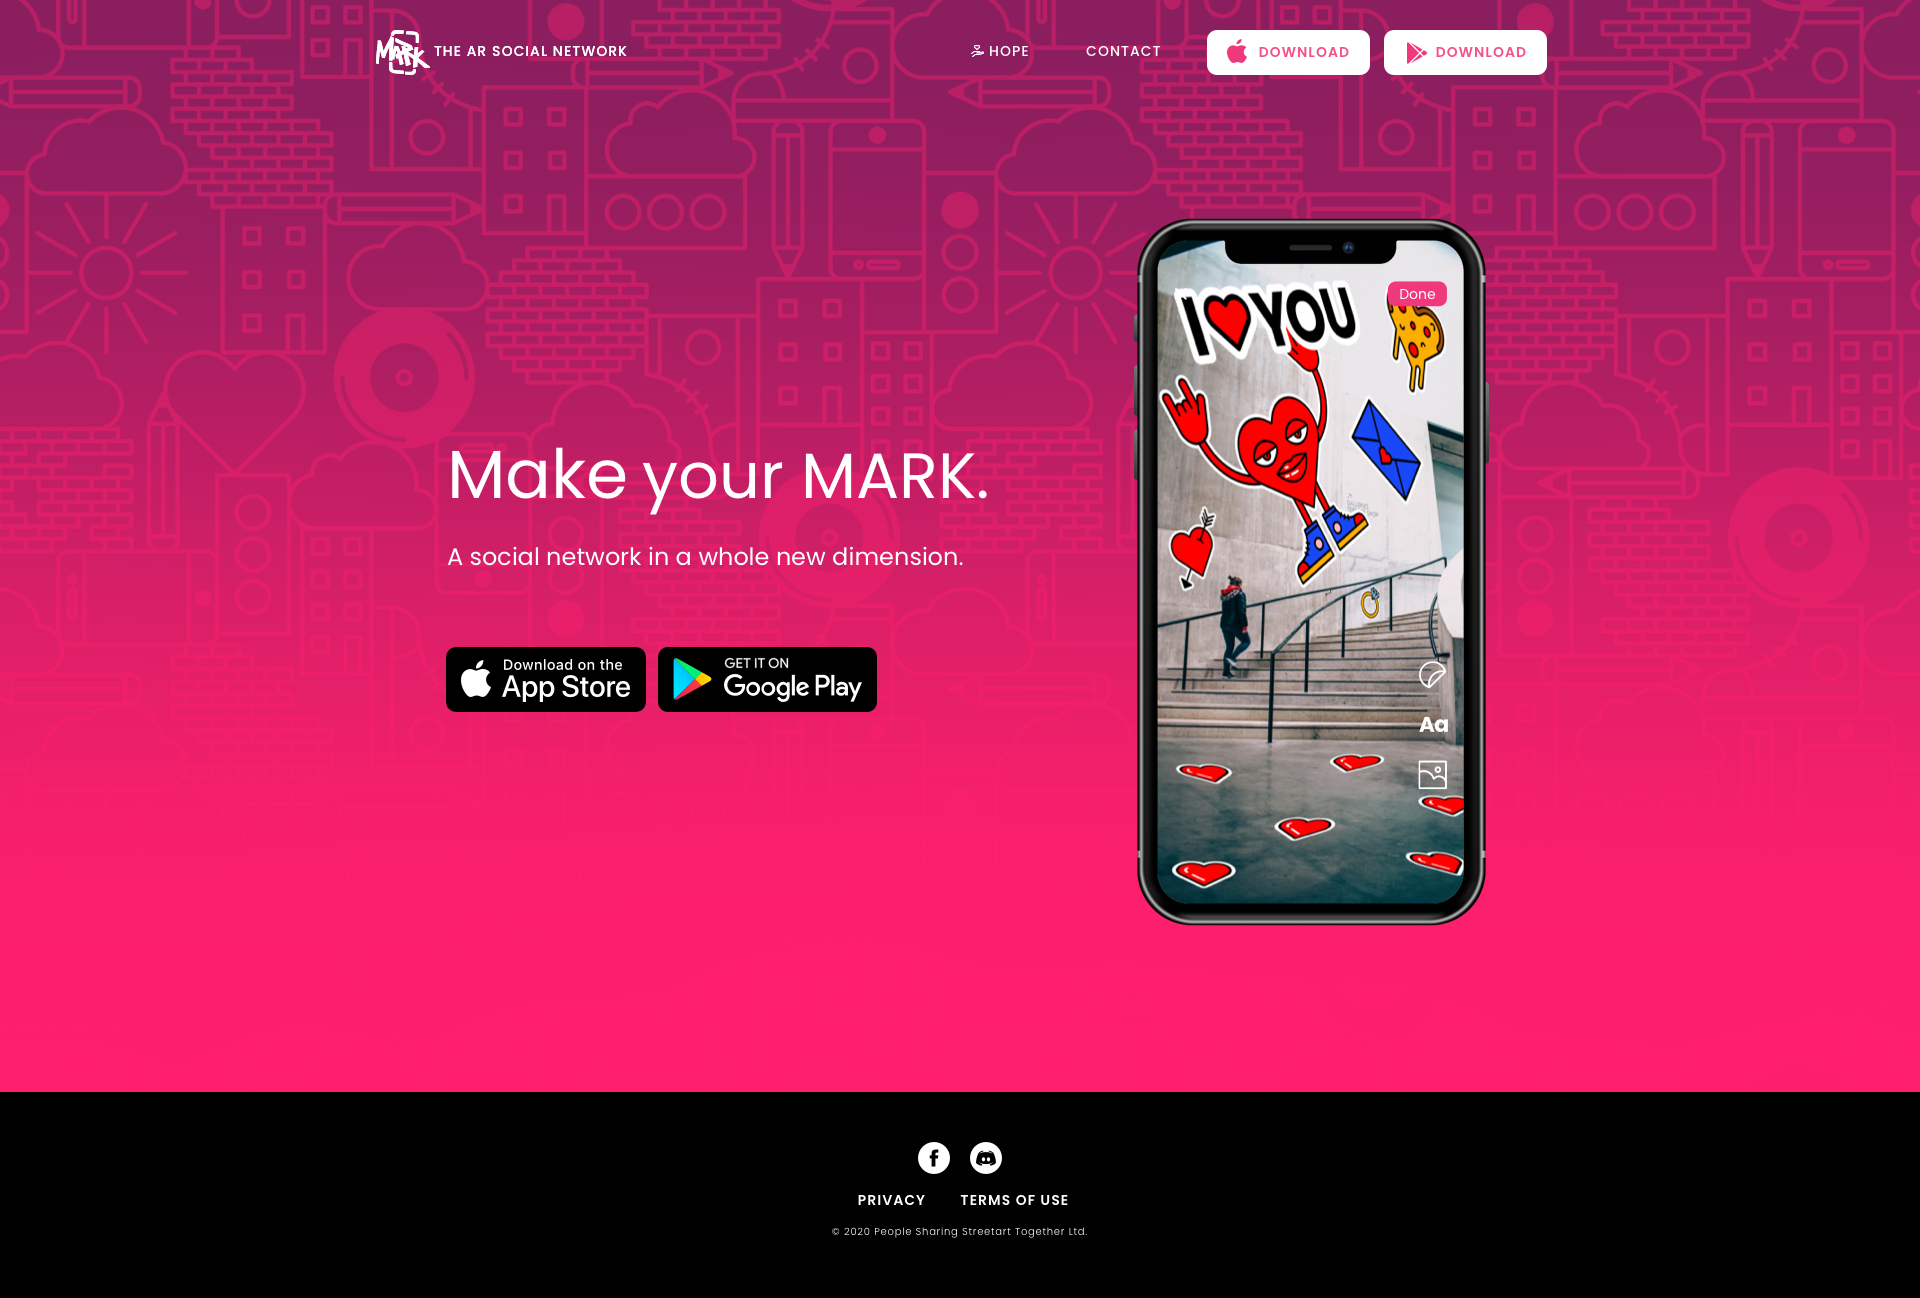
The physical world as a social layer.
MARK is built on a single premise: location is a social context. Place AR content — art, messages, reactions — at a real-world coordinate, and anyone who walks past that spot can discover it. The platform connects strangers not through profiles or algorithms, but through shared physical space.
MARK was kickstarted in late 2019. I joined the team in March 2020, mid-development, with the platform already live but bleeding users at onboarding — over 60% drop-off before sign-up completion. In practice the role meant syncing a split team (AR development in the UK, native app in HK), establishing cross-team design systems, leading six enhancement sprints, and running a full Design Sprint 2.0 to redefine the product direction for the next cycle.
00 — Kickoff
Joined mid-stream. First job: sync everyone up.
When a designer joins a live product with an active team, the first deliverable isn't a screen — it's a shared understanding of where everything stands. I used structured kickoff sessions to map current product state, open decisions, and team conventions before touching any design file.
Team synchronisation — mapping product state, open decisions, and responsibilities across UK AR and HK Native teams
No shared conventions means duplicated work and inconsistent output.
I introduced clear guidelines for user story structure, file naming, and design organisation. This was a precondition for design consistency across a split team working across time zones — without it, neither team could reliably pick up each other's work.
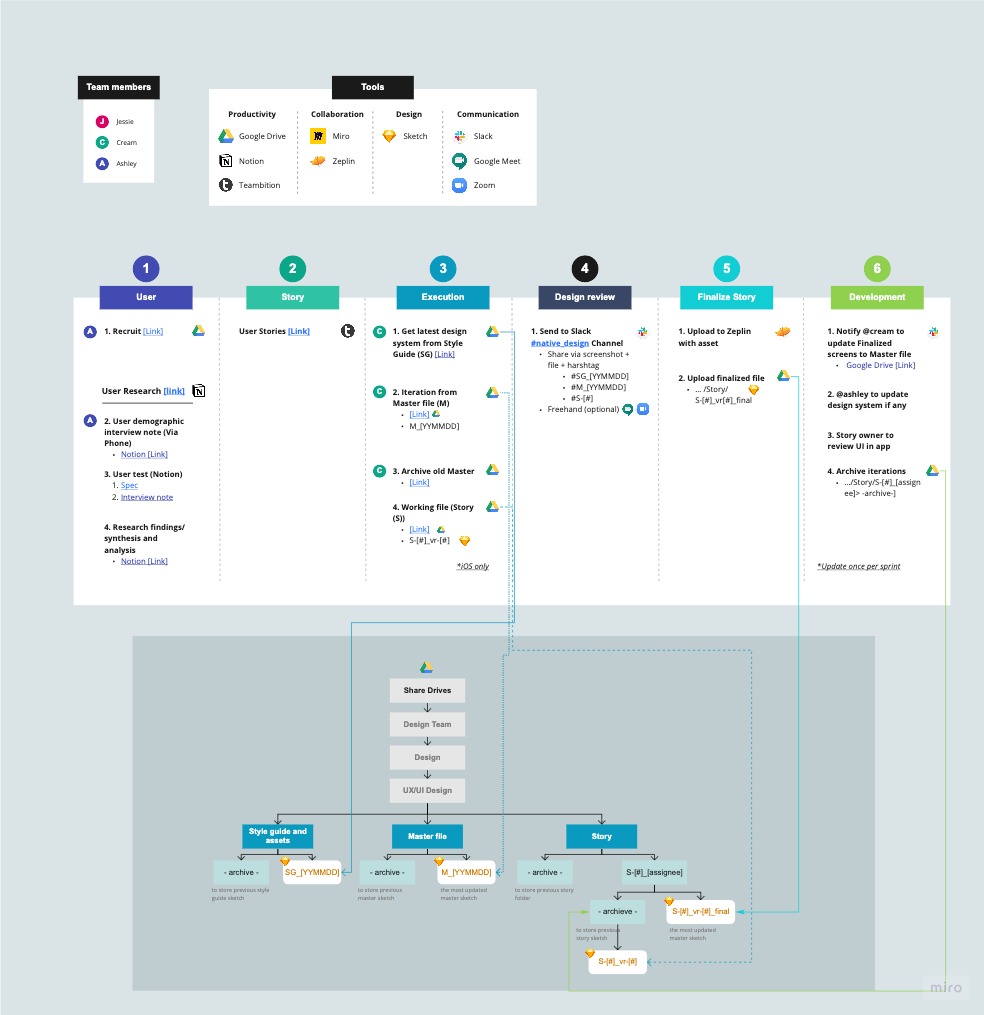
Workflow and file management structure — user story conventions, naming rules, and design organisation guidelines
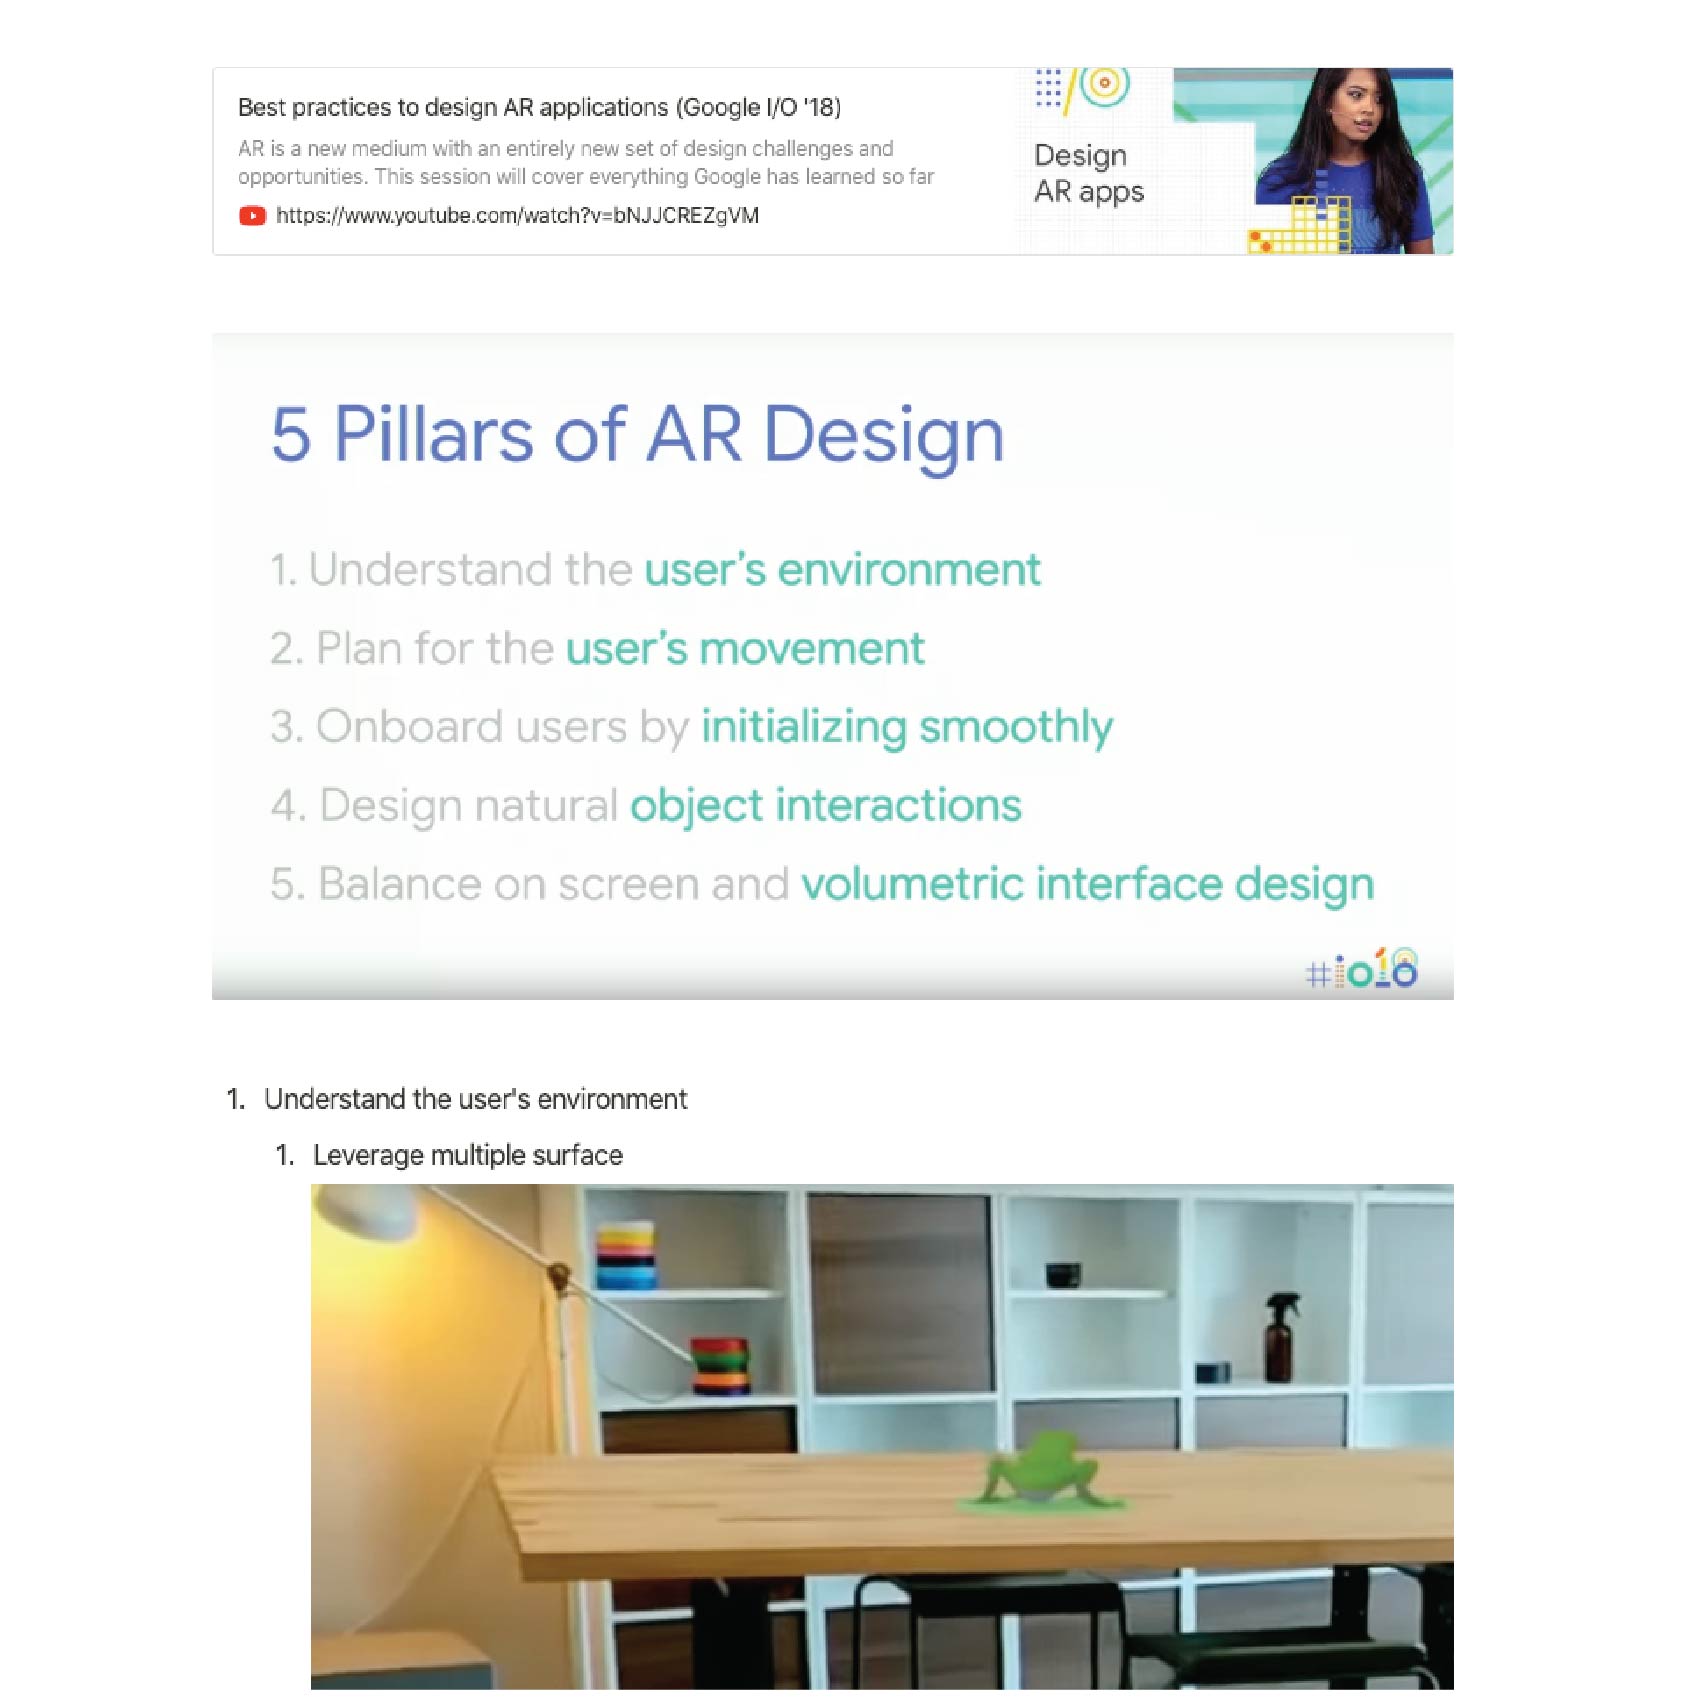
01 — Research
Studying the AR social space — and diagnosing what the existing build was missing.
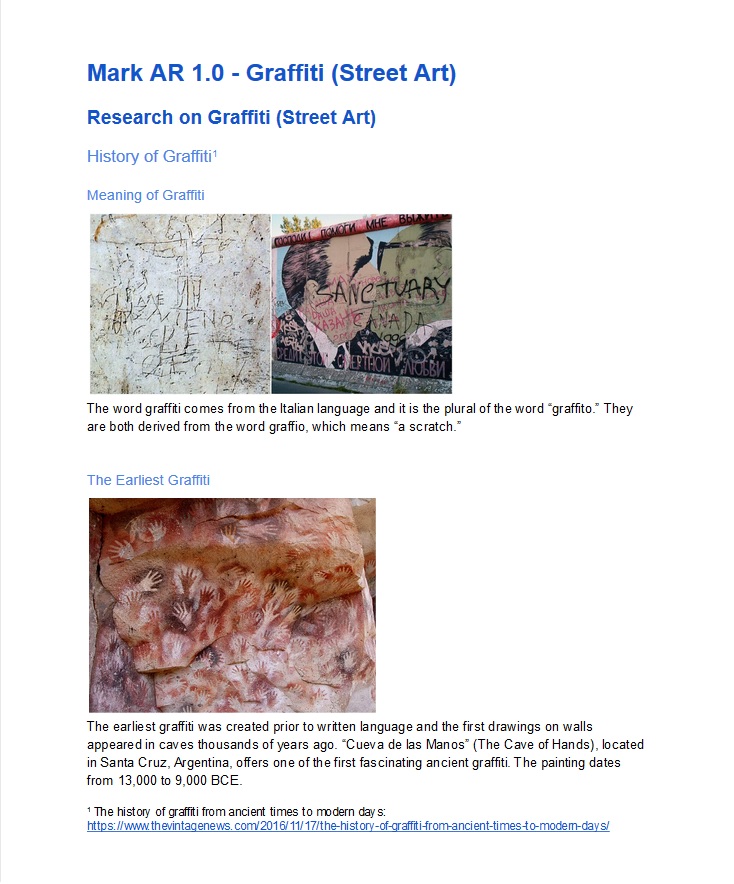
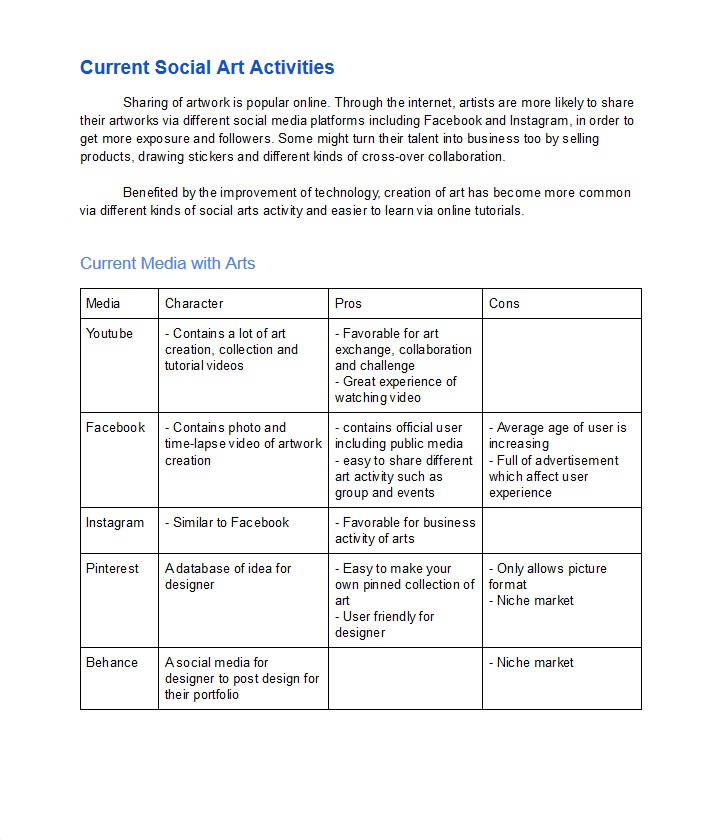
MARK was positioned around streetart as an AR anchor in the US market. My research ran in parallel to product enhancement: while improving the current build, I studied the intersection of streetart, AR, and social media to understand what the product could actually become — and where the current screens were falling short.
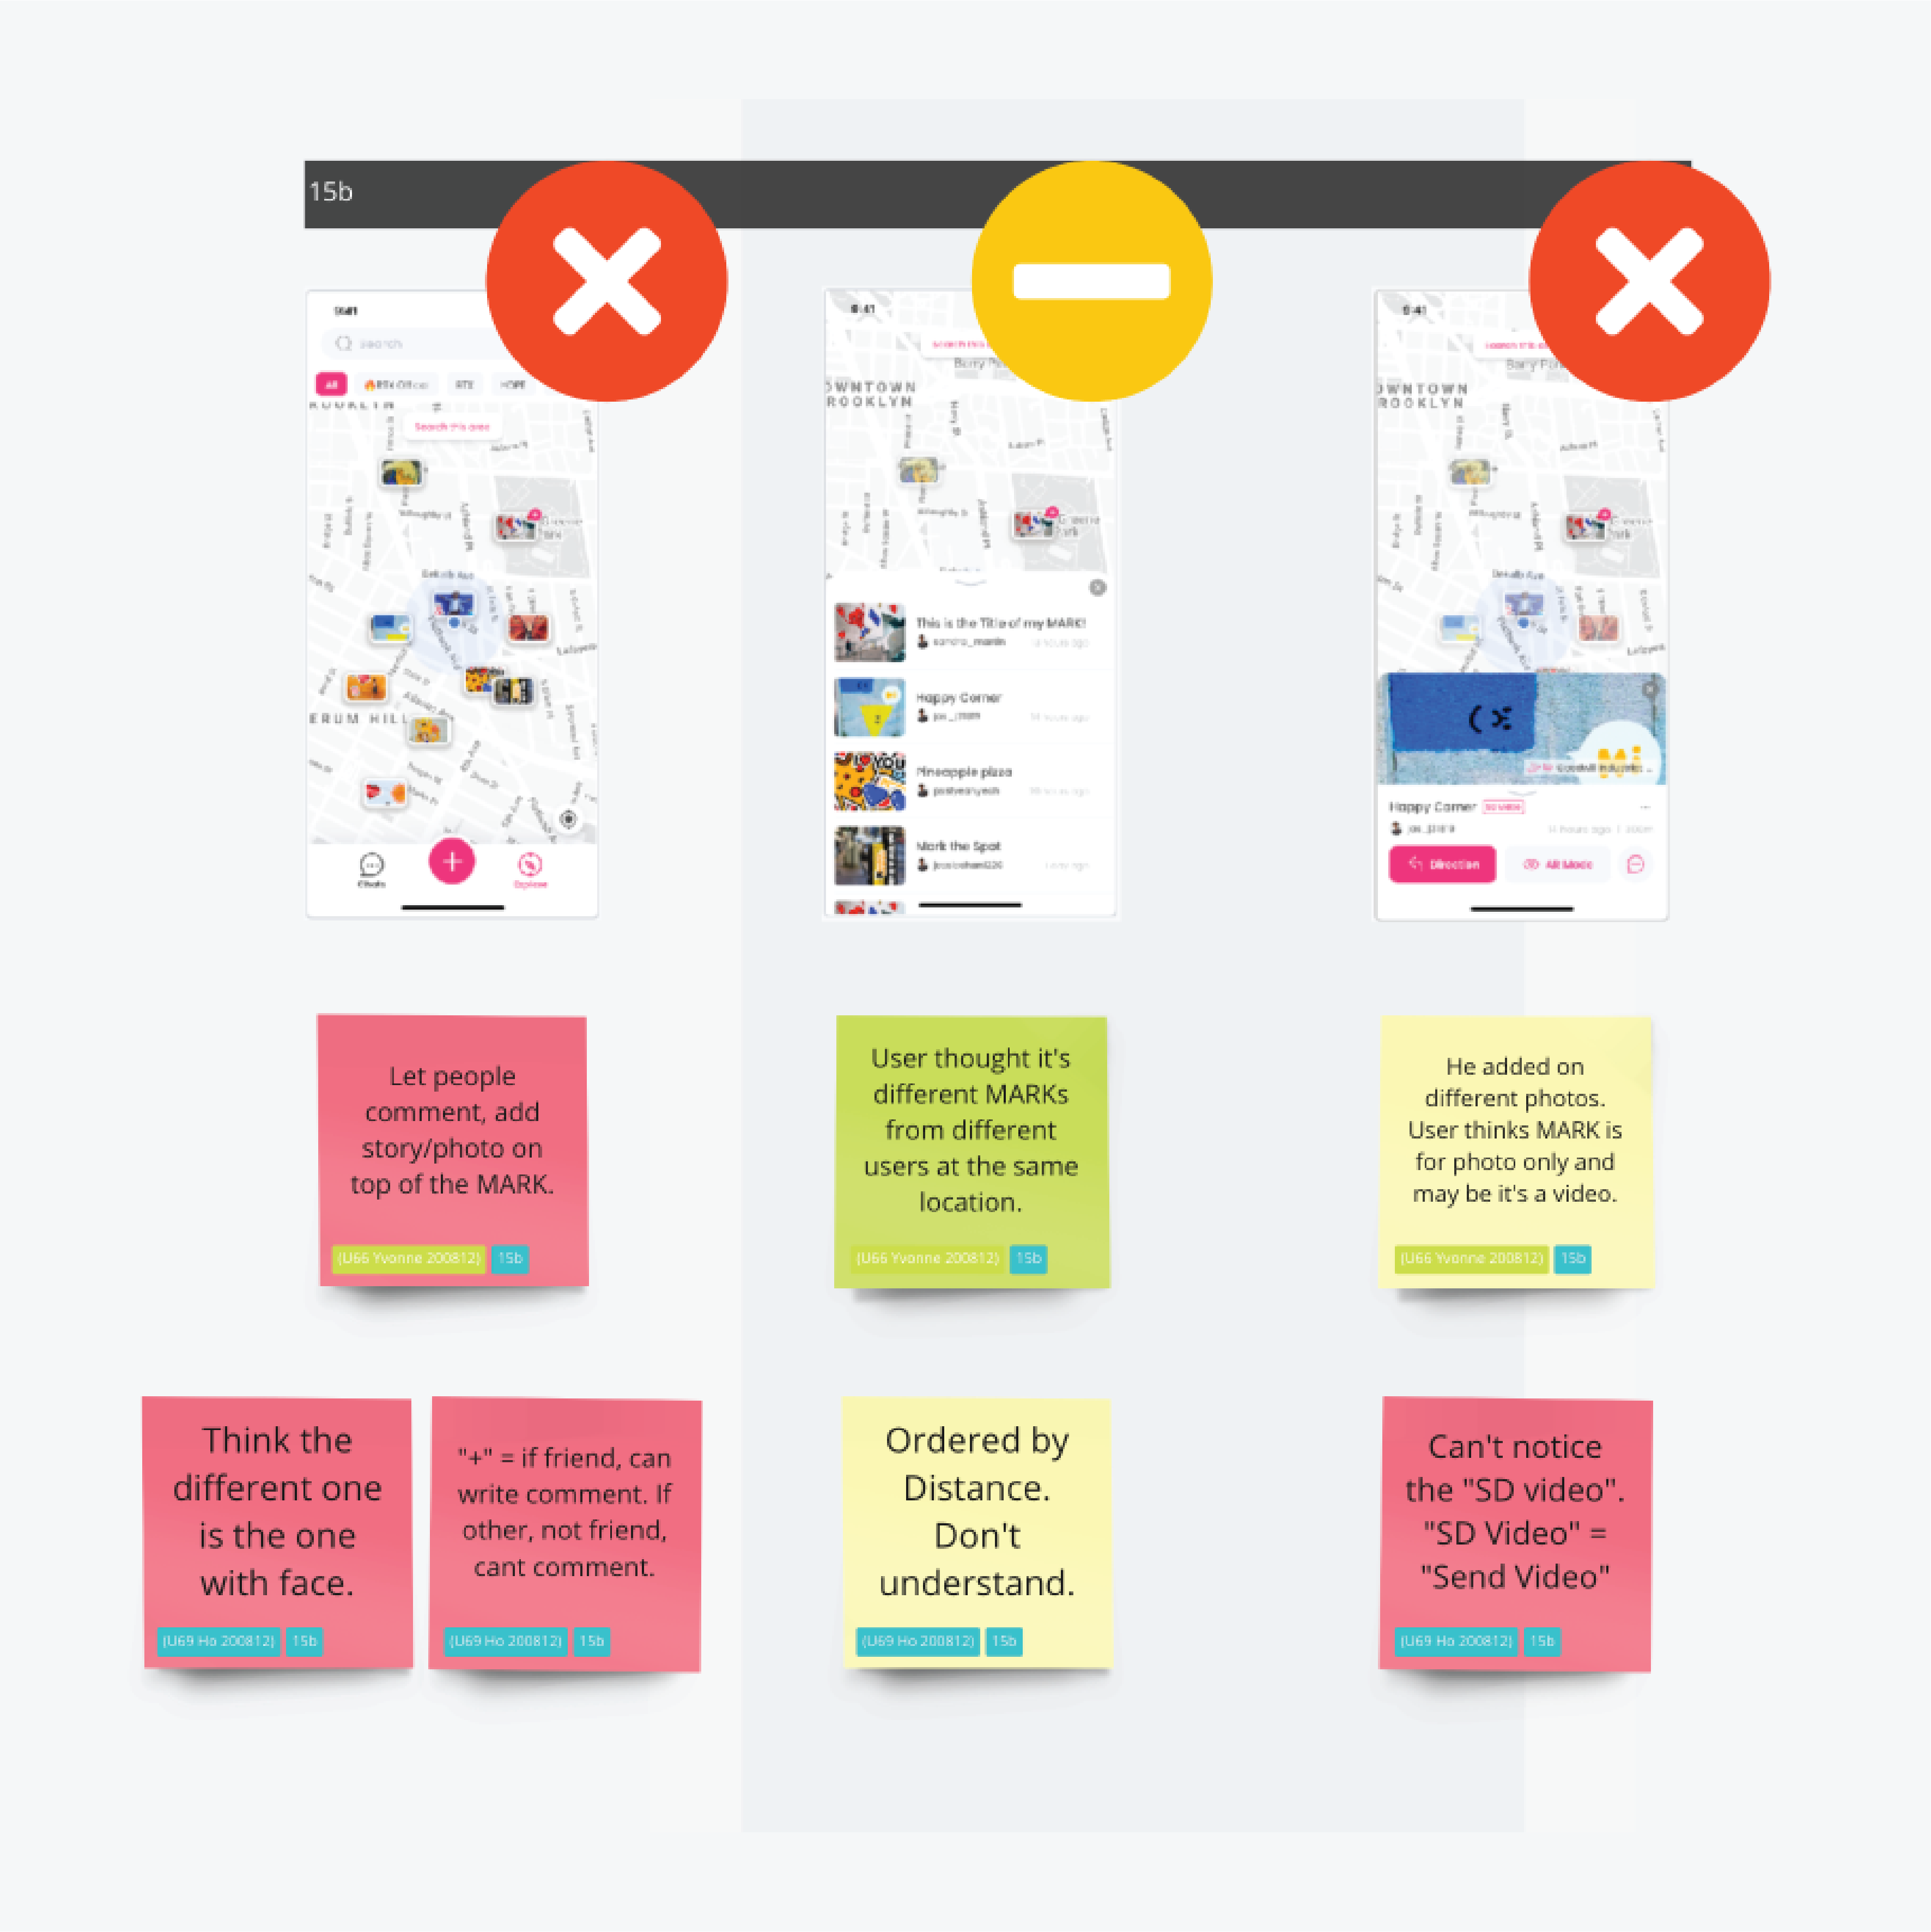
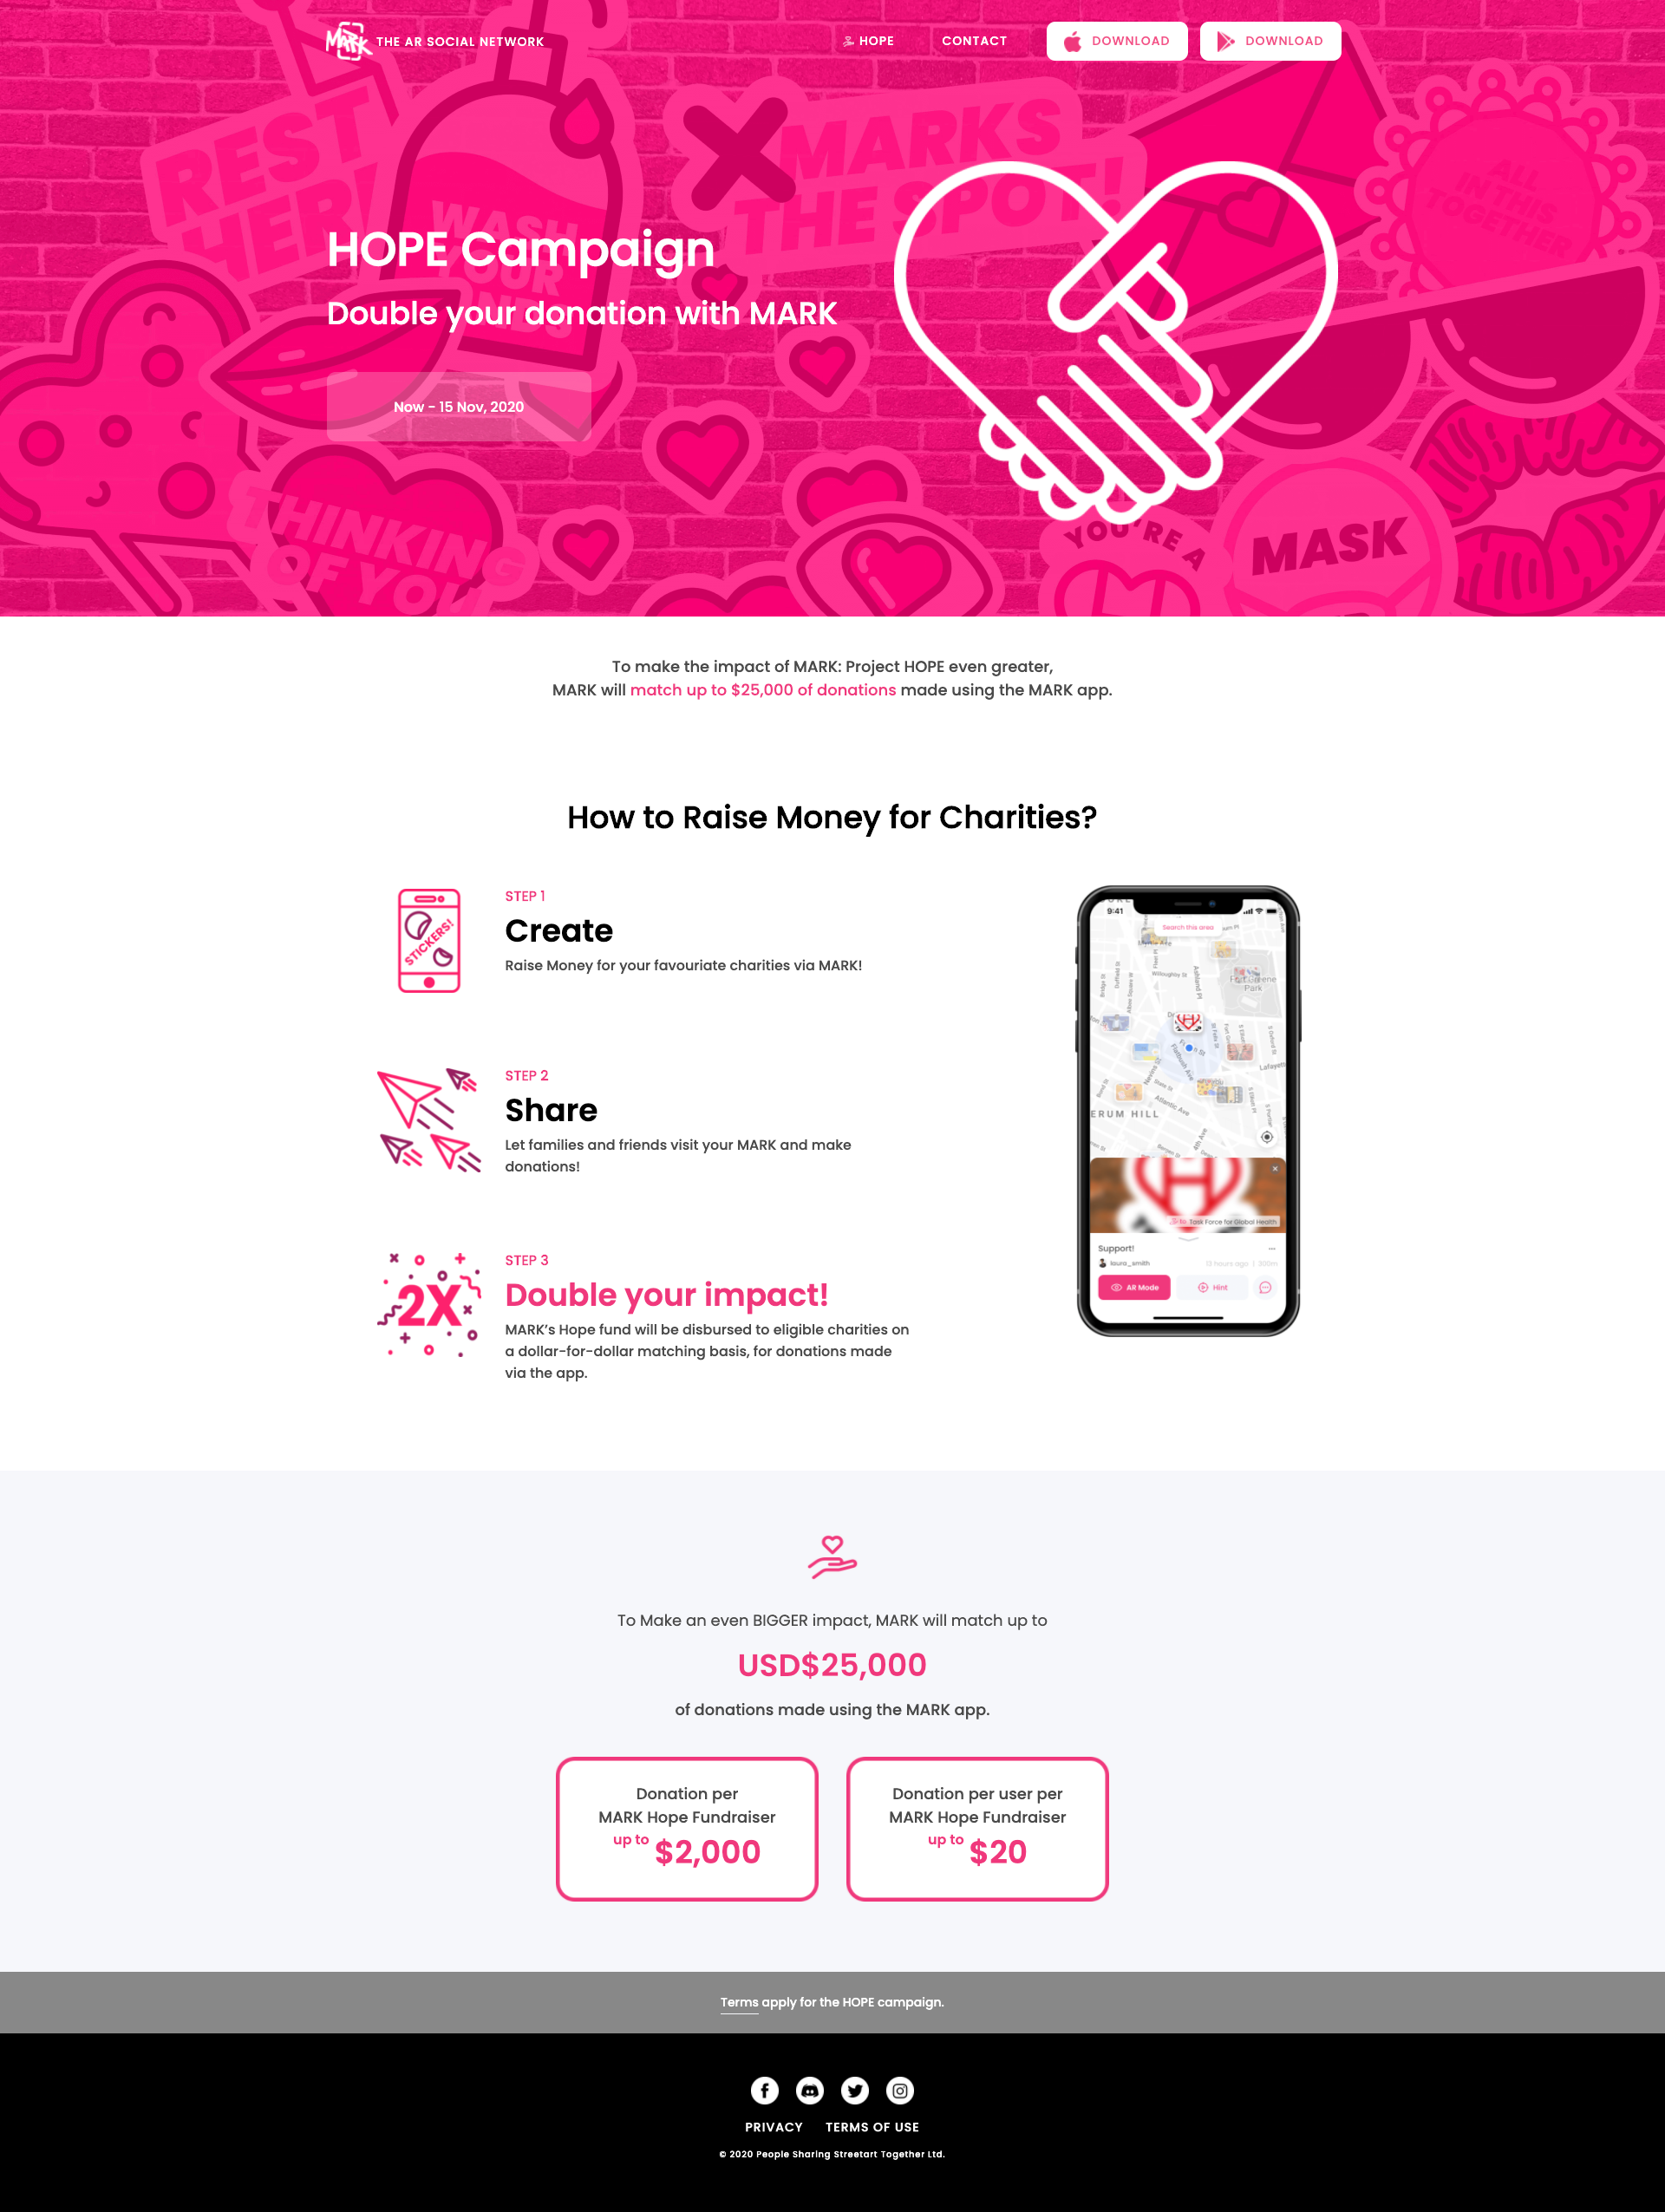
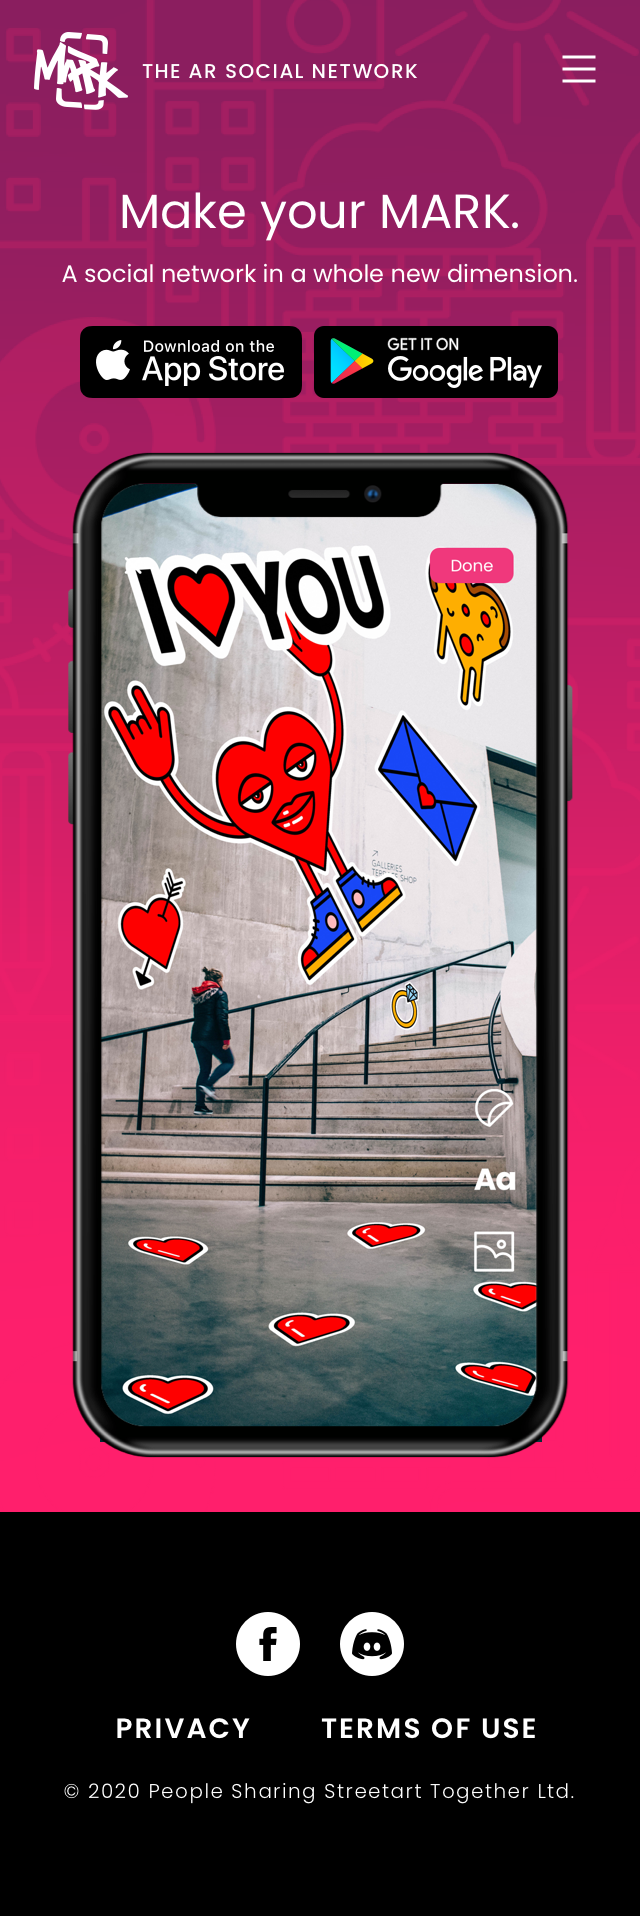
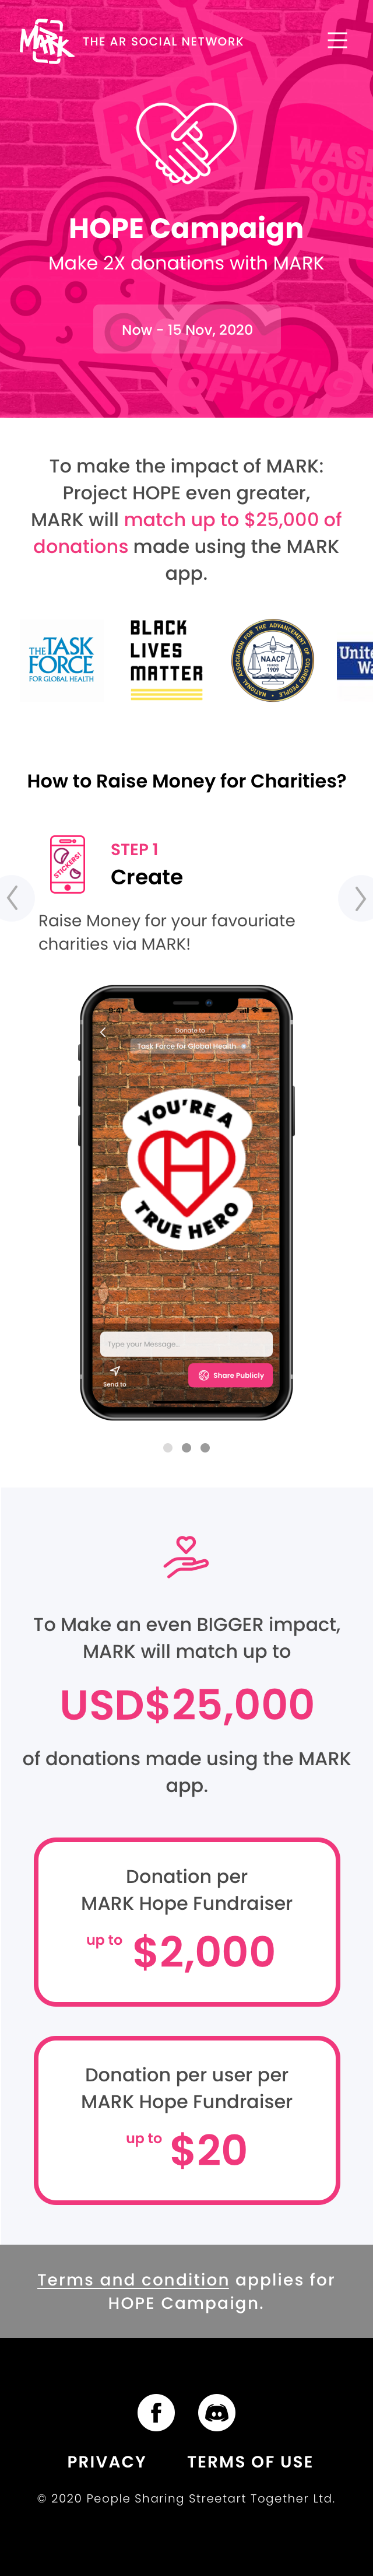
Initial screens showed a platform with strong AR capability but rough UX — core flows were unclear, the social-location concept wasn't being communicated to users, and visual hierarchy prioritised feature access over user goals.
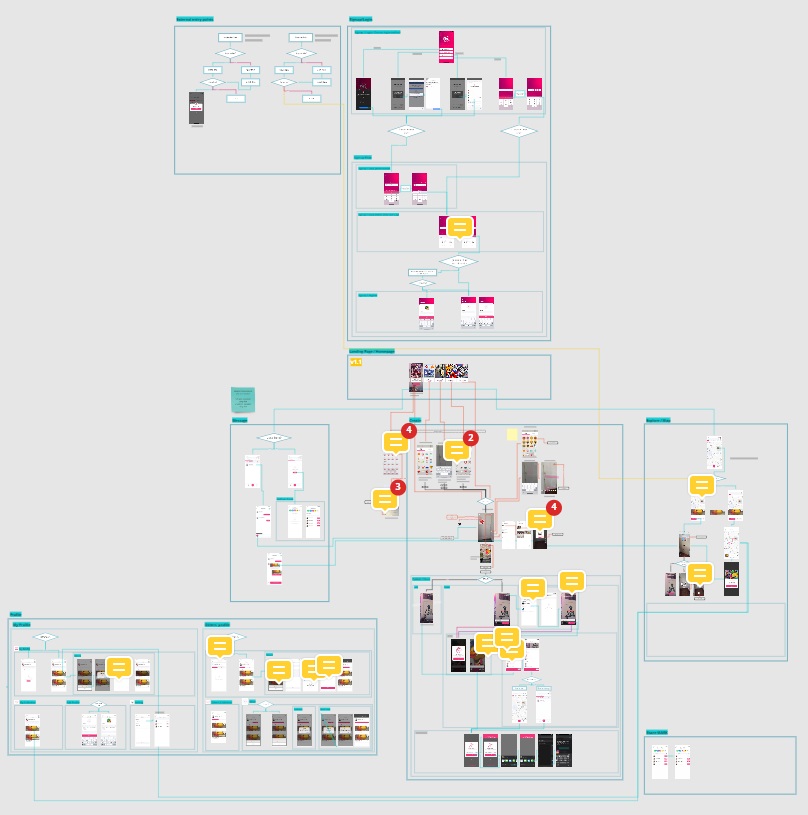
Initial product build — screens reviewed and analysed at project kickoff. Click any image to enlarge.
02 — S1 Enhancement
Six enhancement areas. One Opportunity Solution Tree to structure them.
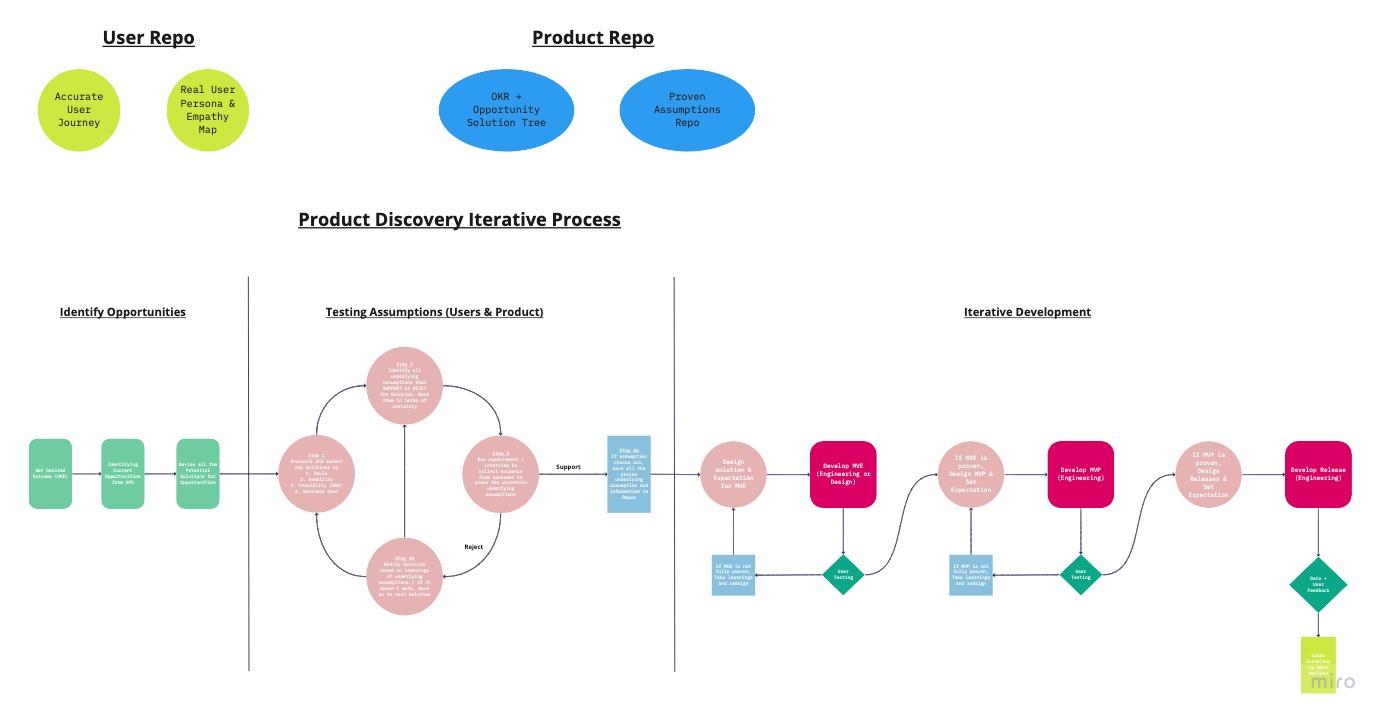
Rather than treating identified issues as a flat backlog, I structured them through an Opportunity Solution Tree — mapping user needs to potential solutions, forcing explicit prioritisation before any design work started. Six enhancement areas emerged.
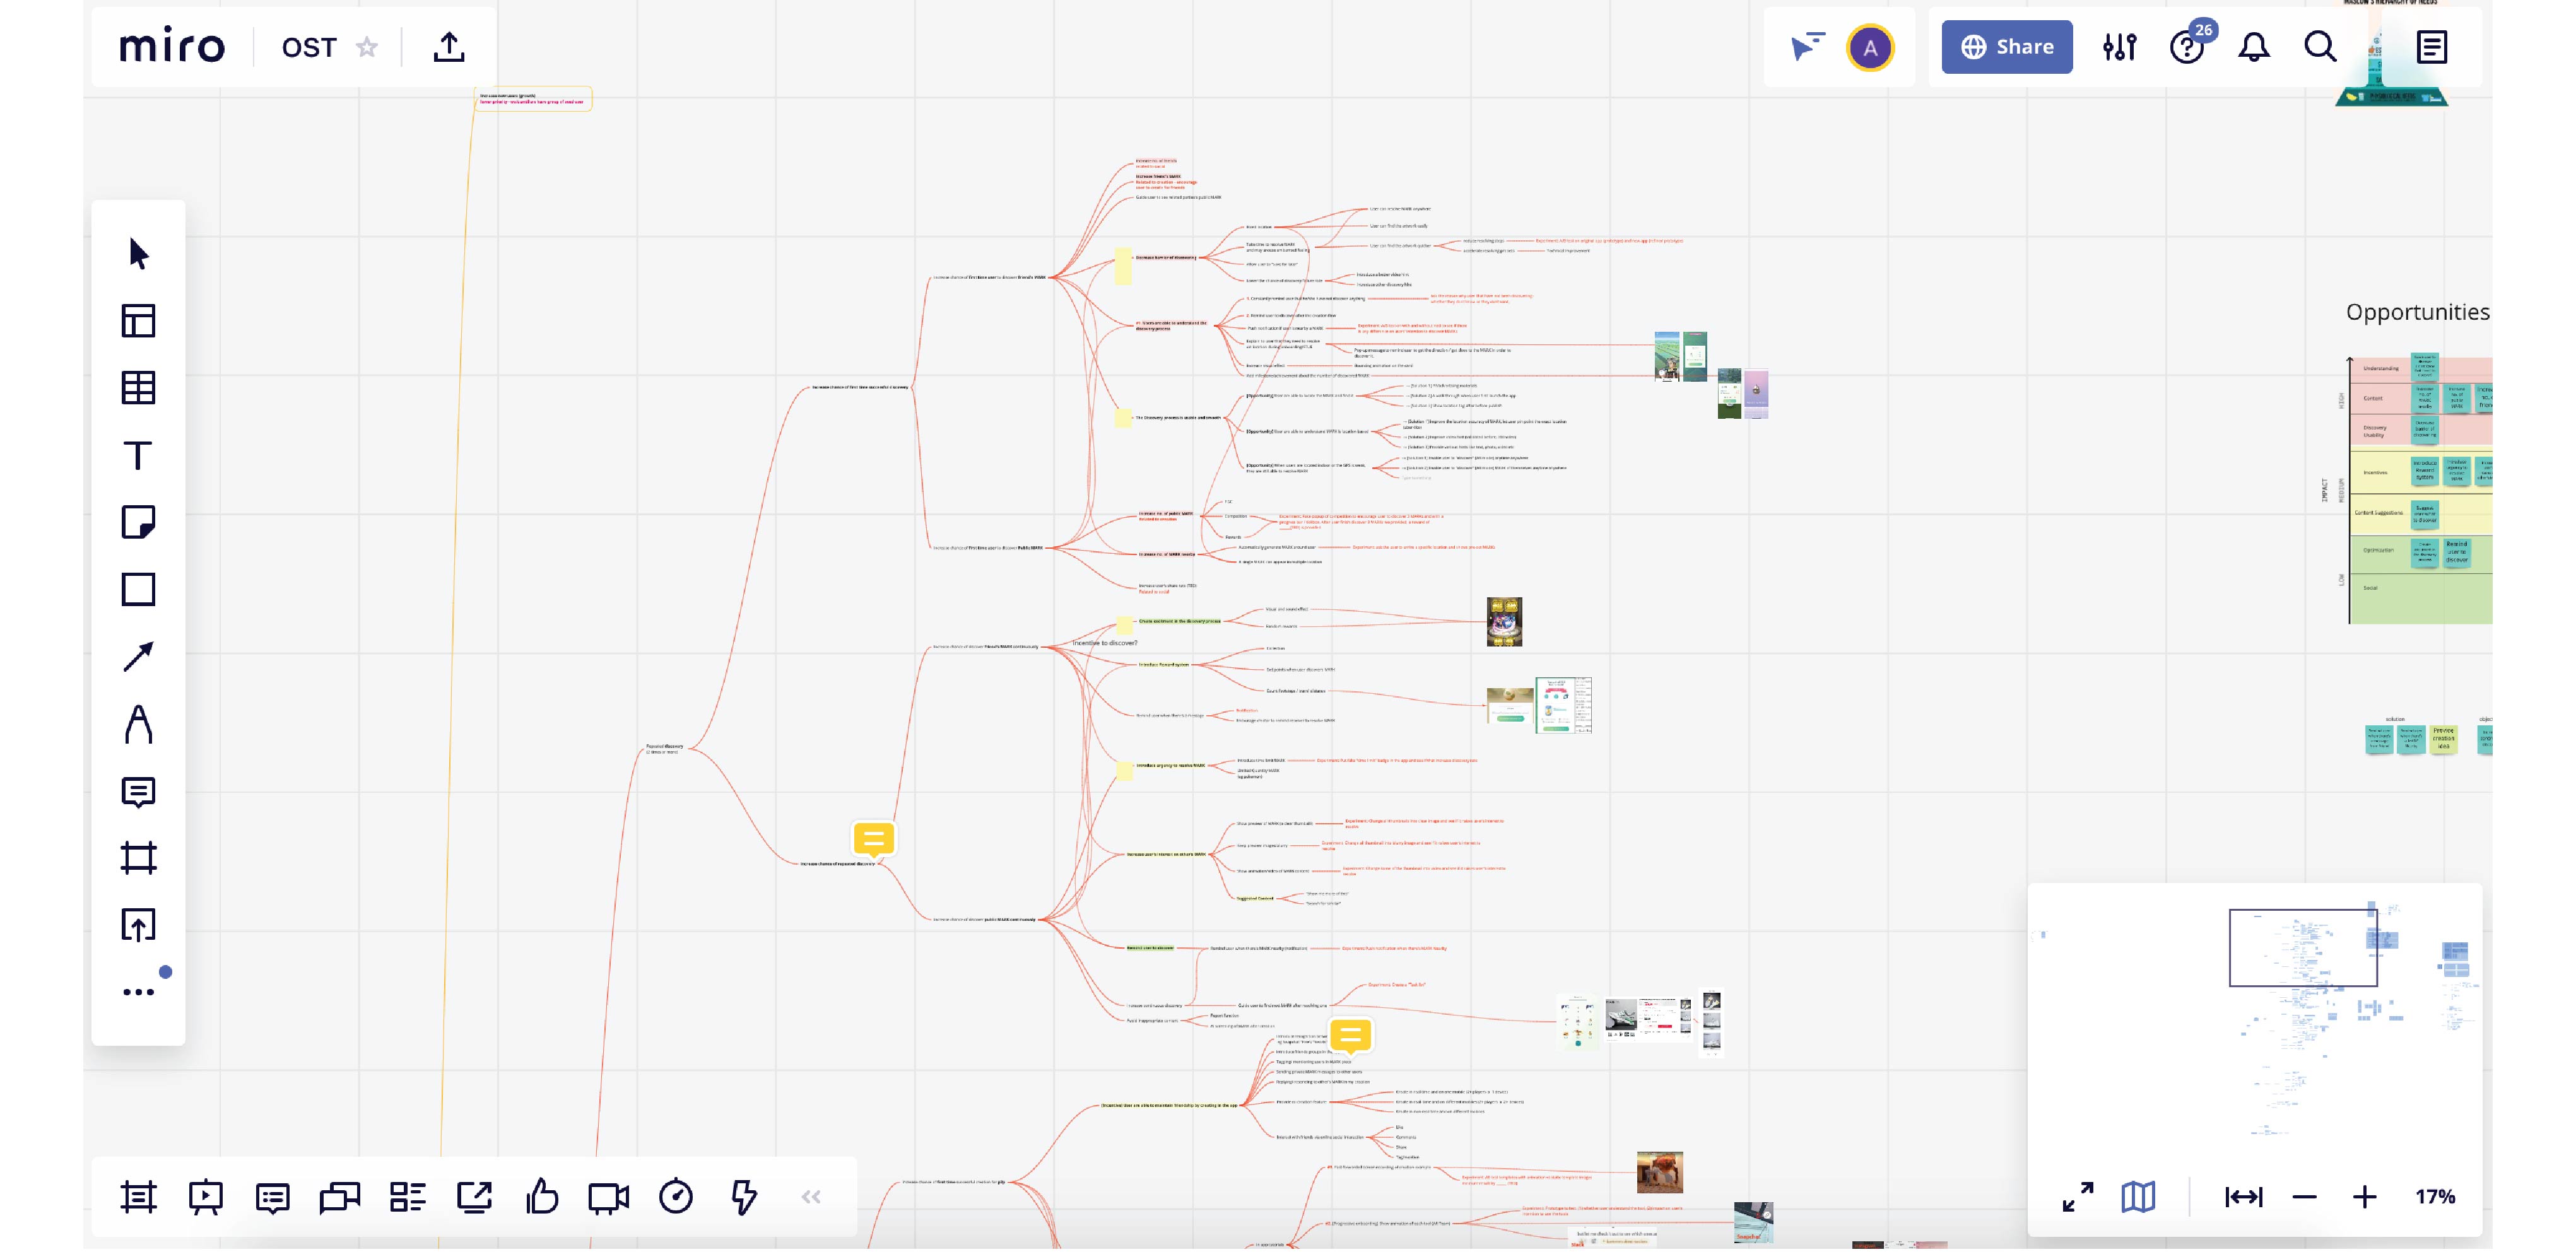
Opportunity Solution Tree — structuring user needs into solvable opportunities before committing to solutions
Impact × Effort to decide what to fix first — and what to defer.
With multiple identified issues and limited sprint capacity, I ran an Impact × Effort grid across both the opportunities and potential solutions. This gave the team a defensible rationale for sequencing decisions rather than defaulting to loudest voice or technical convenience.
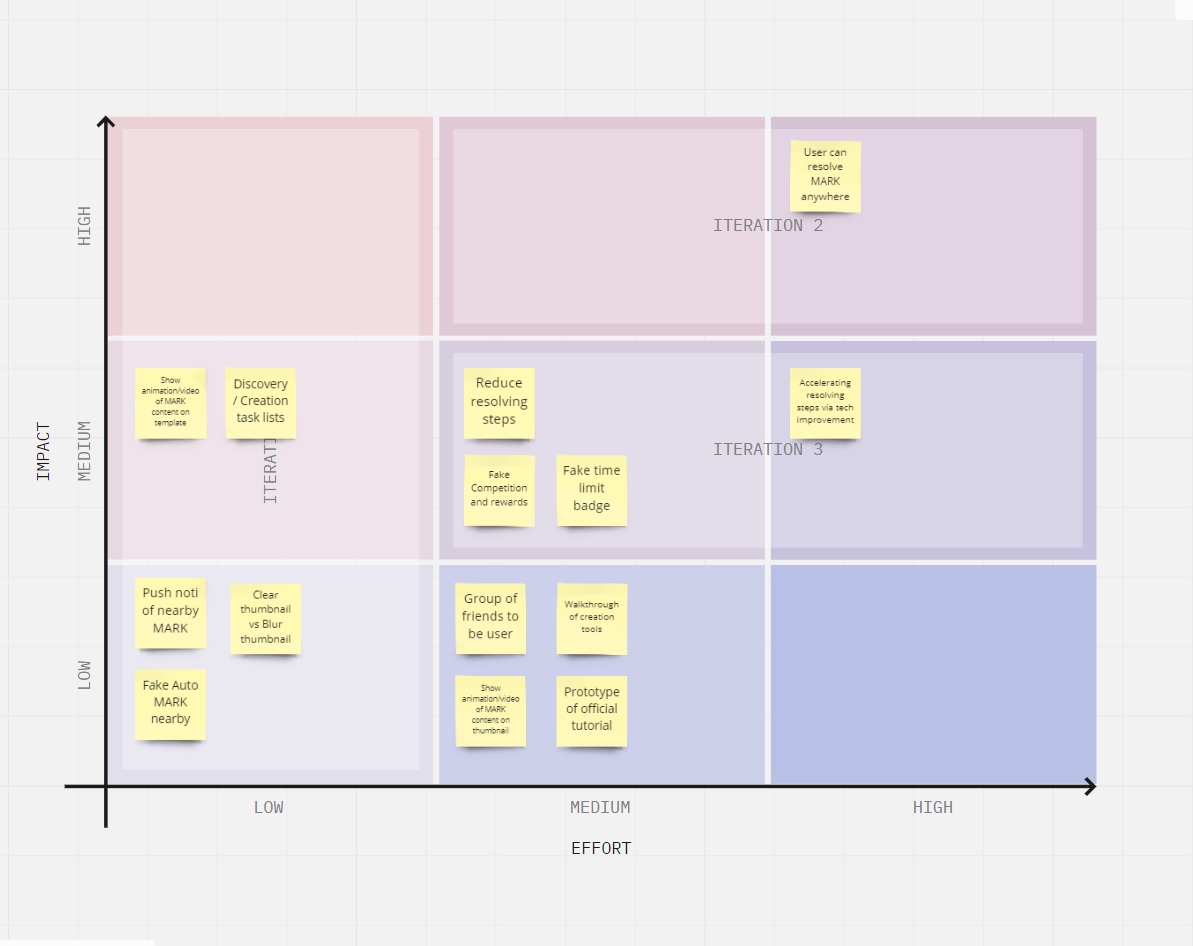
Impact × Effort grids — opportunities (left) and solutions (right). Structured prioritisation before sprint commitment.
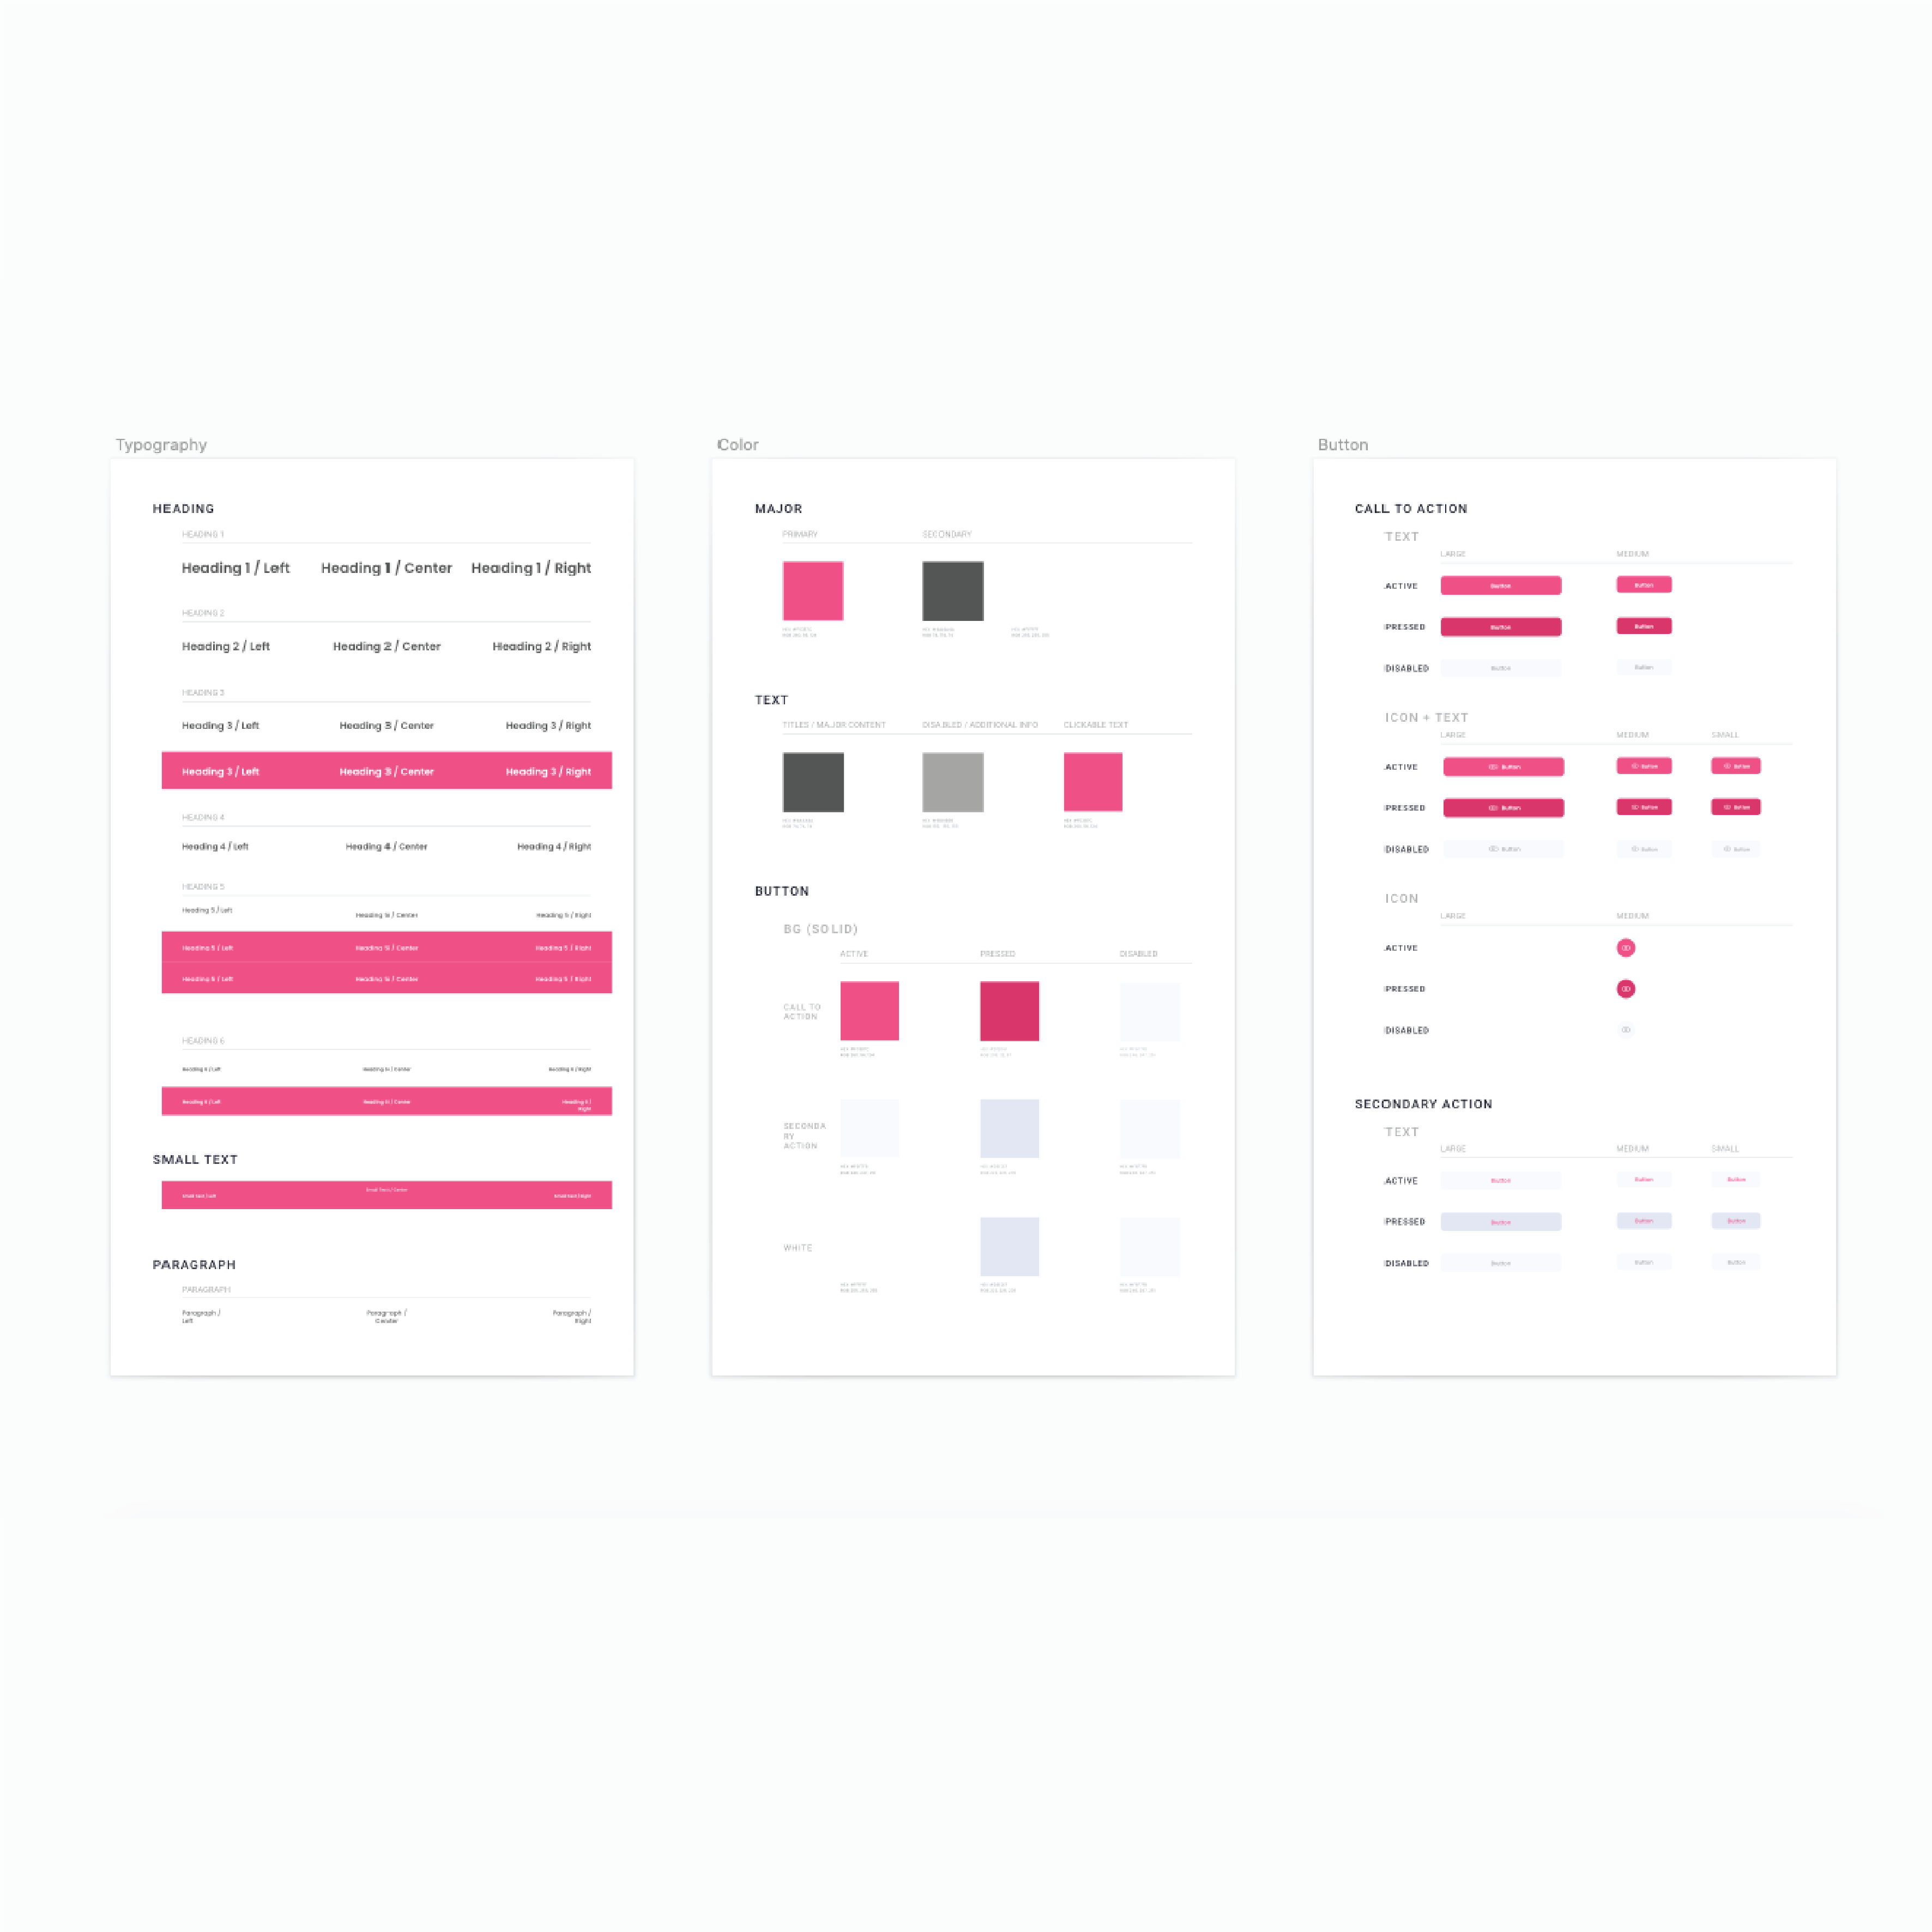
One Sketch design system. Consistent output regardless of who draws the screen.
I built a design system in Sketch based on the visual identity from the communications designer — colours, typography, buttons, component states. Both the UK AR team and the HK Native team could produce consistent screens from the same library, regardless of which designer touched the file.
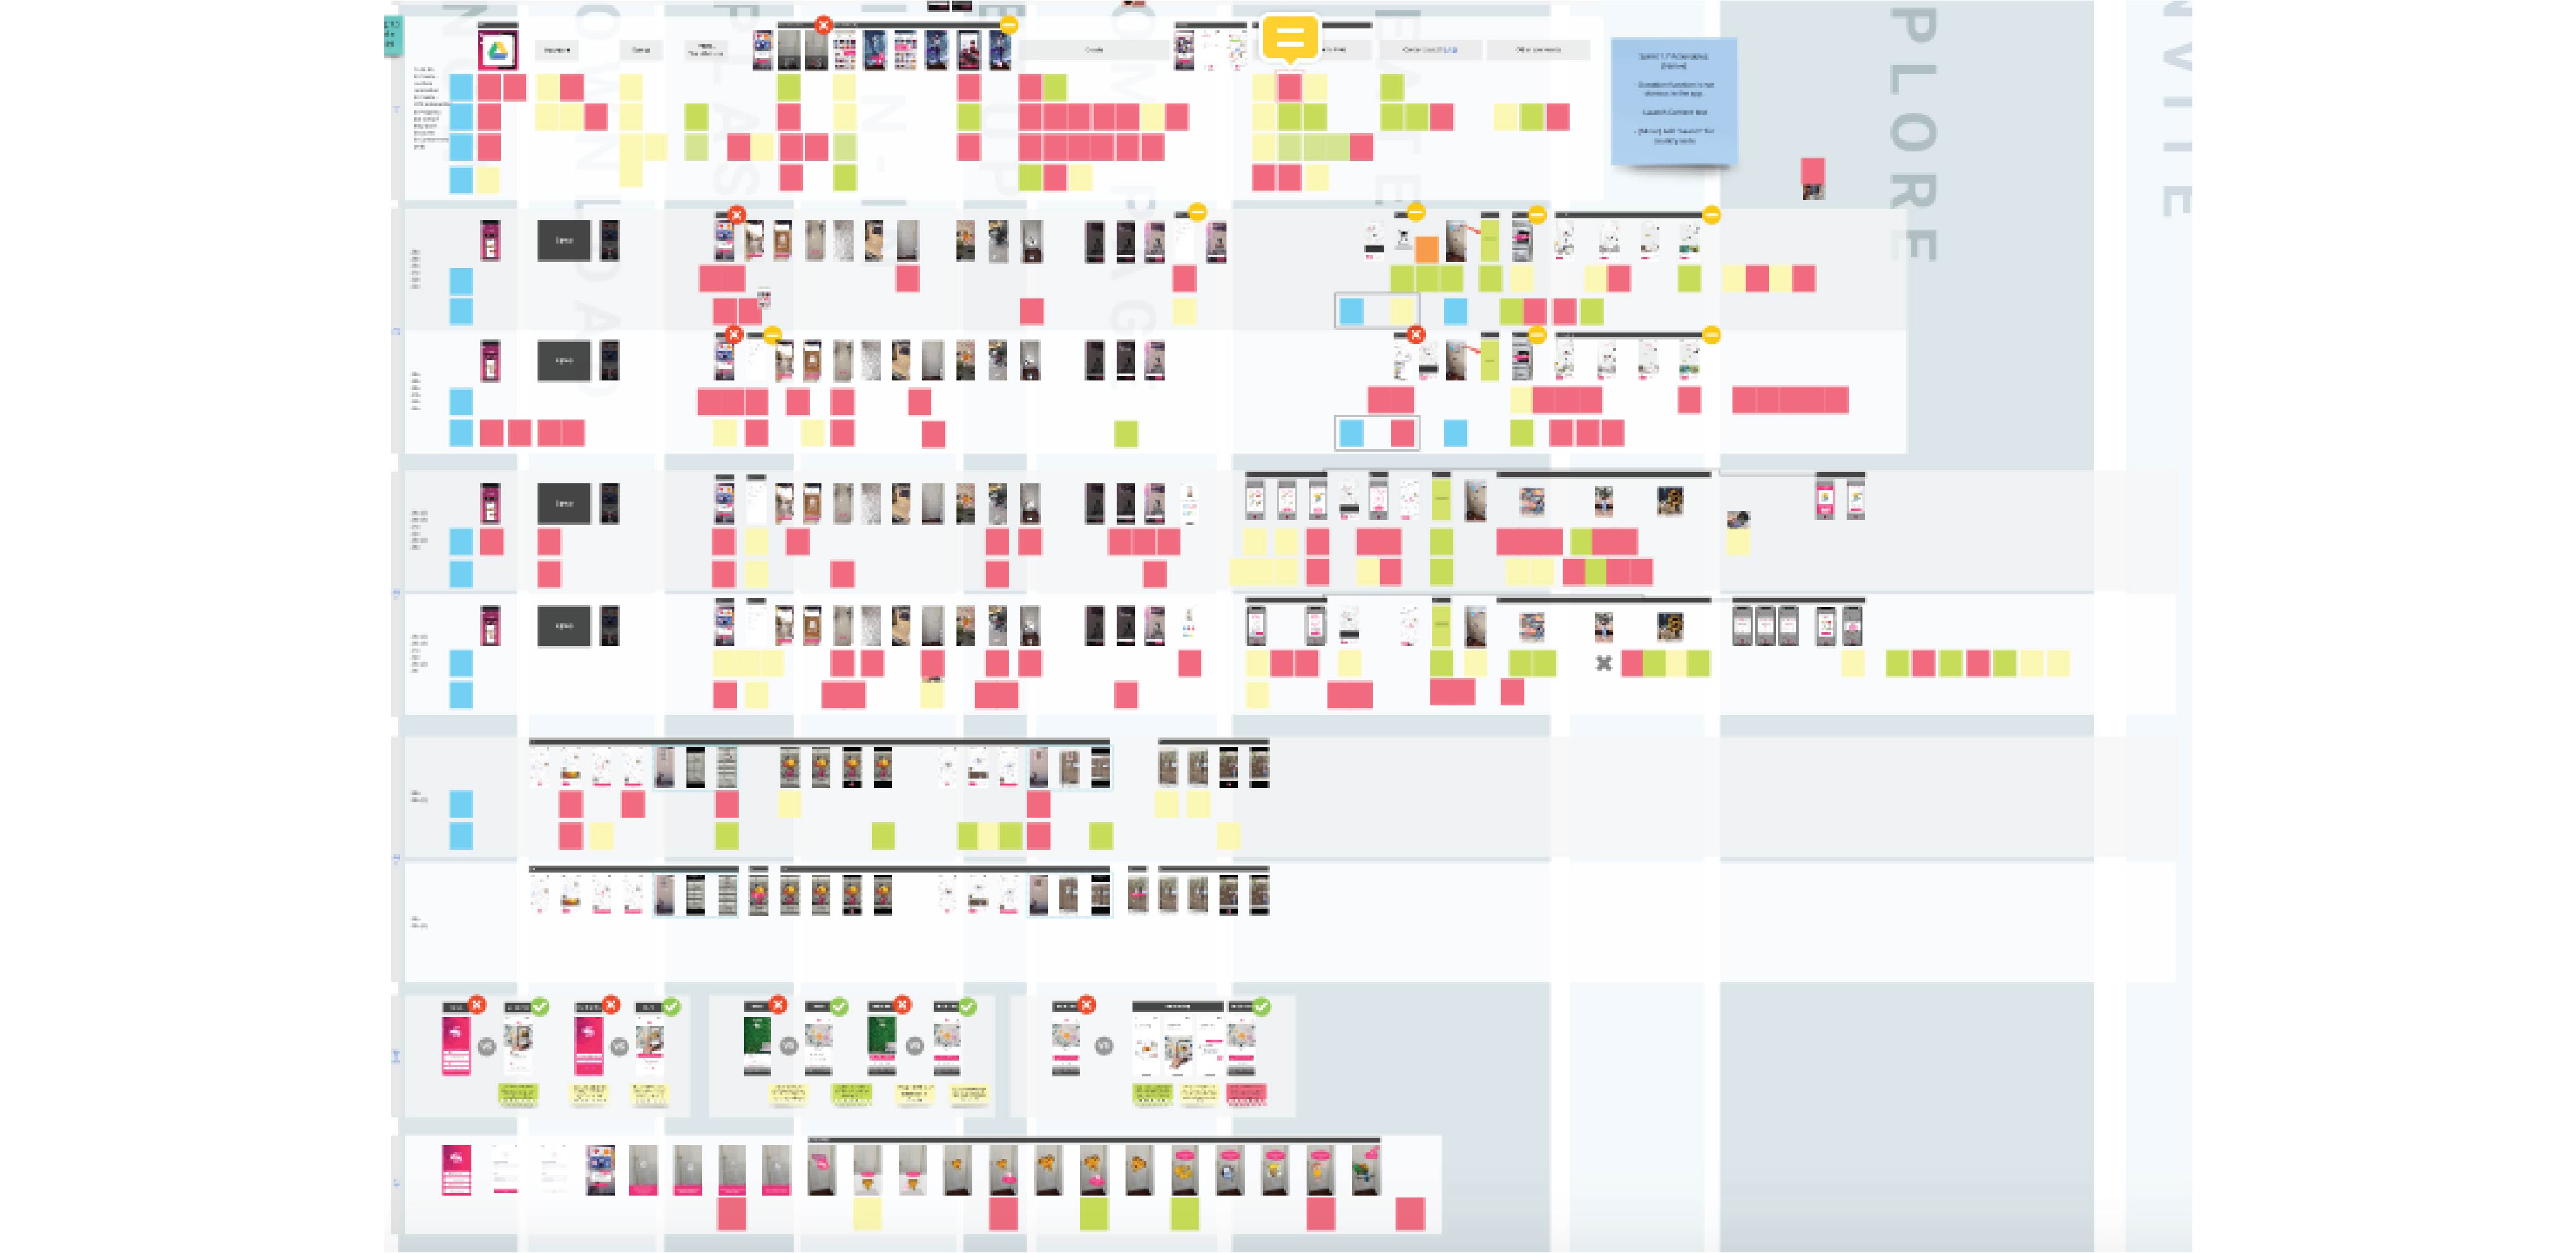
Two teams. Two time zones. One centralised flow document.
With AR development in the UK and native app in HK, there was no shared source of truth for product flow. I introduced a centralised UI flow document both teams could reference — reducing miscommunication and the cost of integration bugs caused by design inconsistencies.
Centralised UI flow — shared across UK AR and HK Native teams as the single source of truth for product interaction
>60% drop-off. 6 of 8 users in UAT couldn't explain what the app did.
Qualitative testing revealed the root issue: users were being asked to sign up for a product they didn't understand. MARK's core value — the social-location AR experience — was never shown before the commitment gate. I redesigned the onboarding from scratch with a demo-first structure, validated with a 5-second test and A/B methodology.
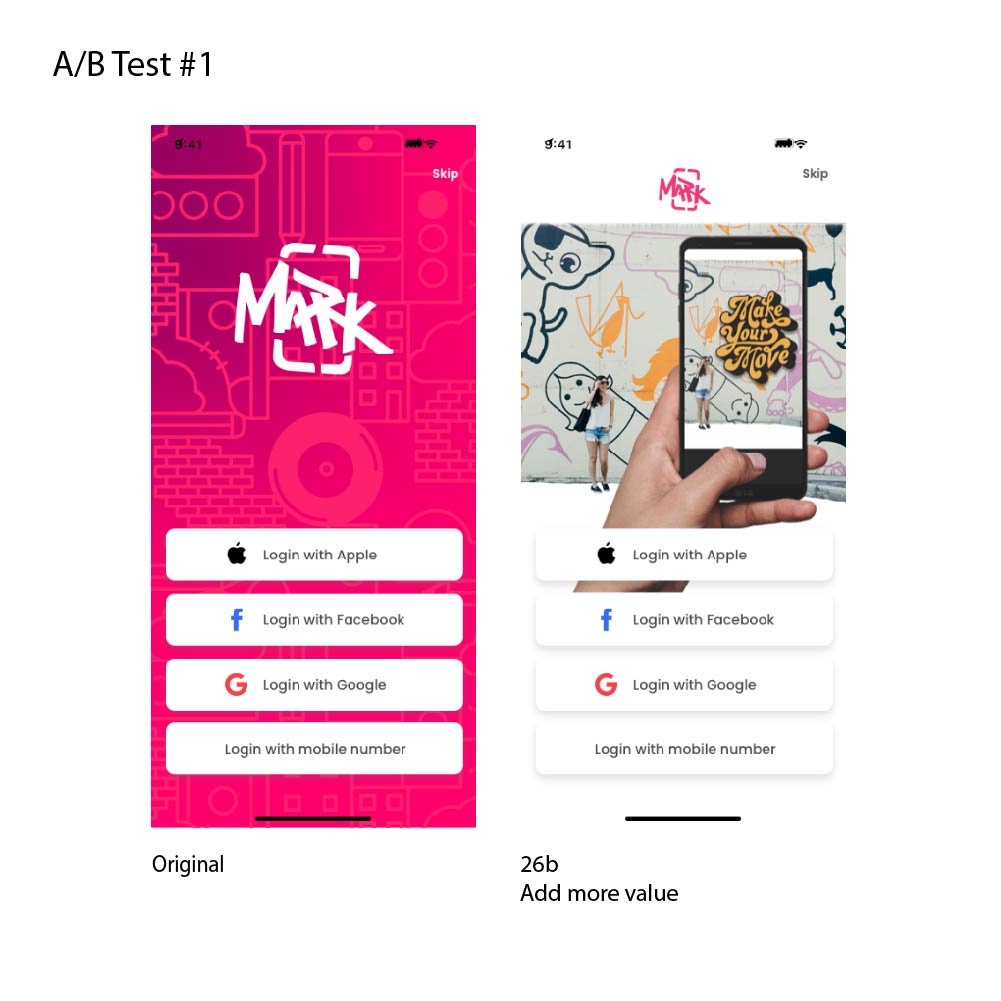
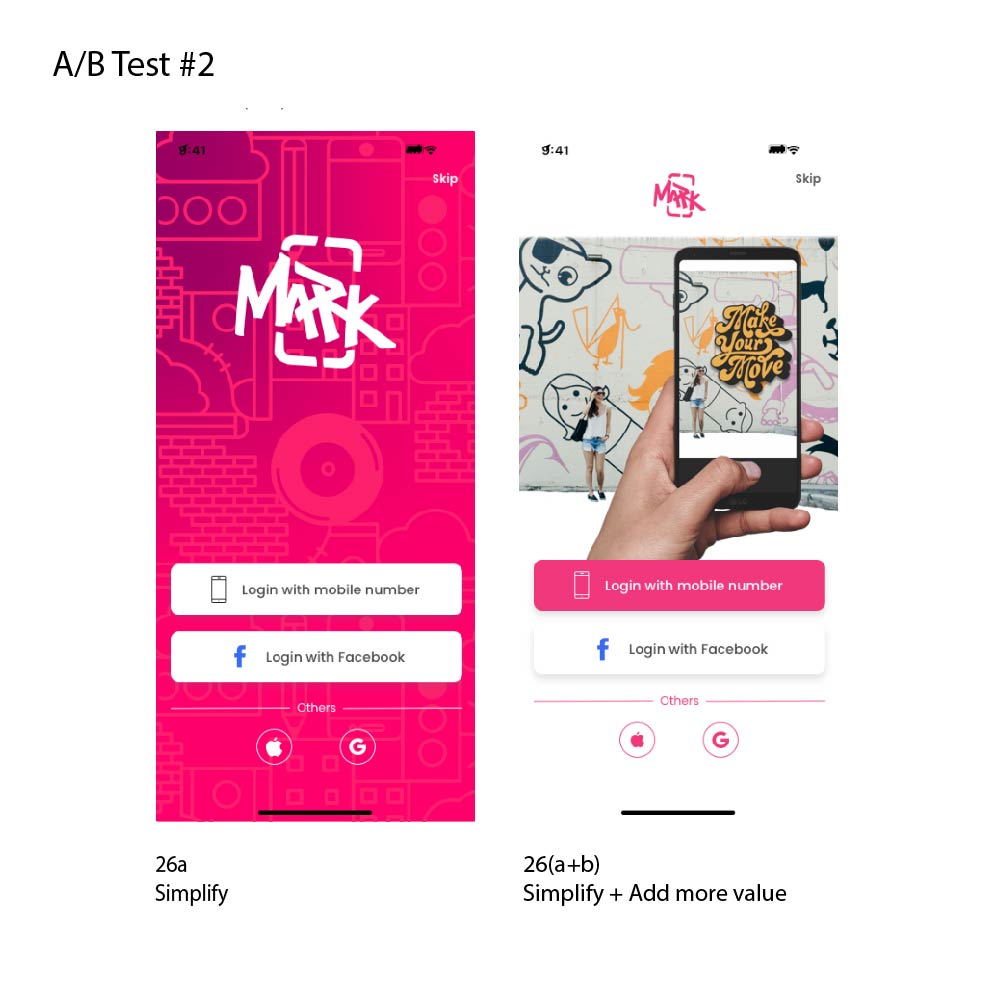
Onboarding before (left) and after redesign (right). Click to enlarge.
5-second test + A/B results — users could identify value propositions post-redesign, but 20% still showed no intent to sign up, triggering Design Sprint 2.0
New users need to make something before they can discover anything.
With minimal user-generated content at launch, a discovery-first landing page gave new users an empty experience. Fix: change the default landing from Discovery to Creation, and design a template-based create flow so users could see a result immediately — understanding the product by making something rather than finding nothing.
GPS at street level isn't accurate enough. Visual context is.
GPS variance at close range made it unreliable for navigating a user to an AR content point. I introduced a photo hint system — when placing AR content, users add a reference photo of the physical landmark. Discoverers see this photo as a directional hint, resolving the last-metre navigation problem without requiring precision hardware.
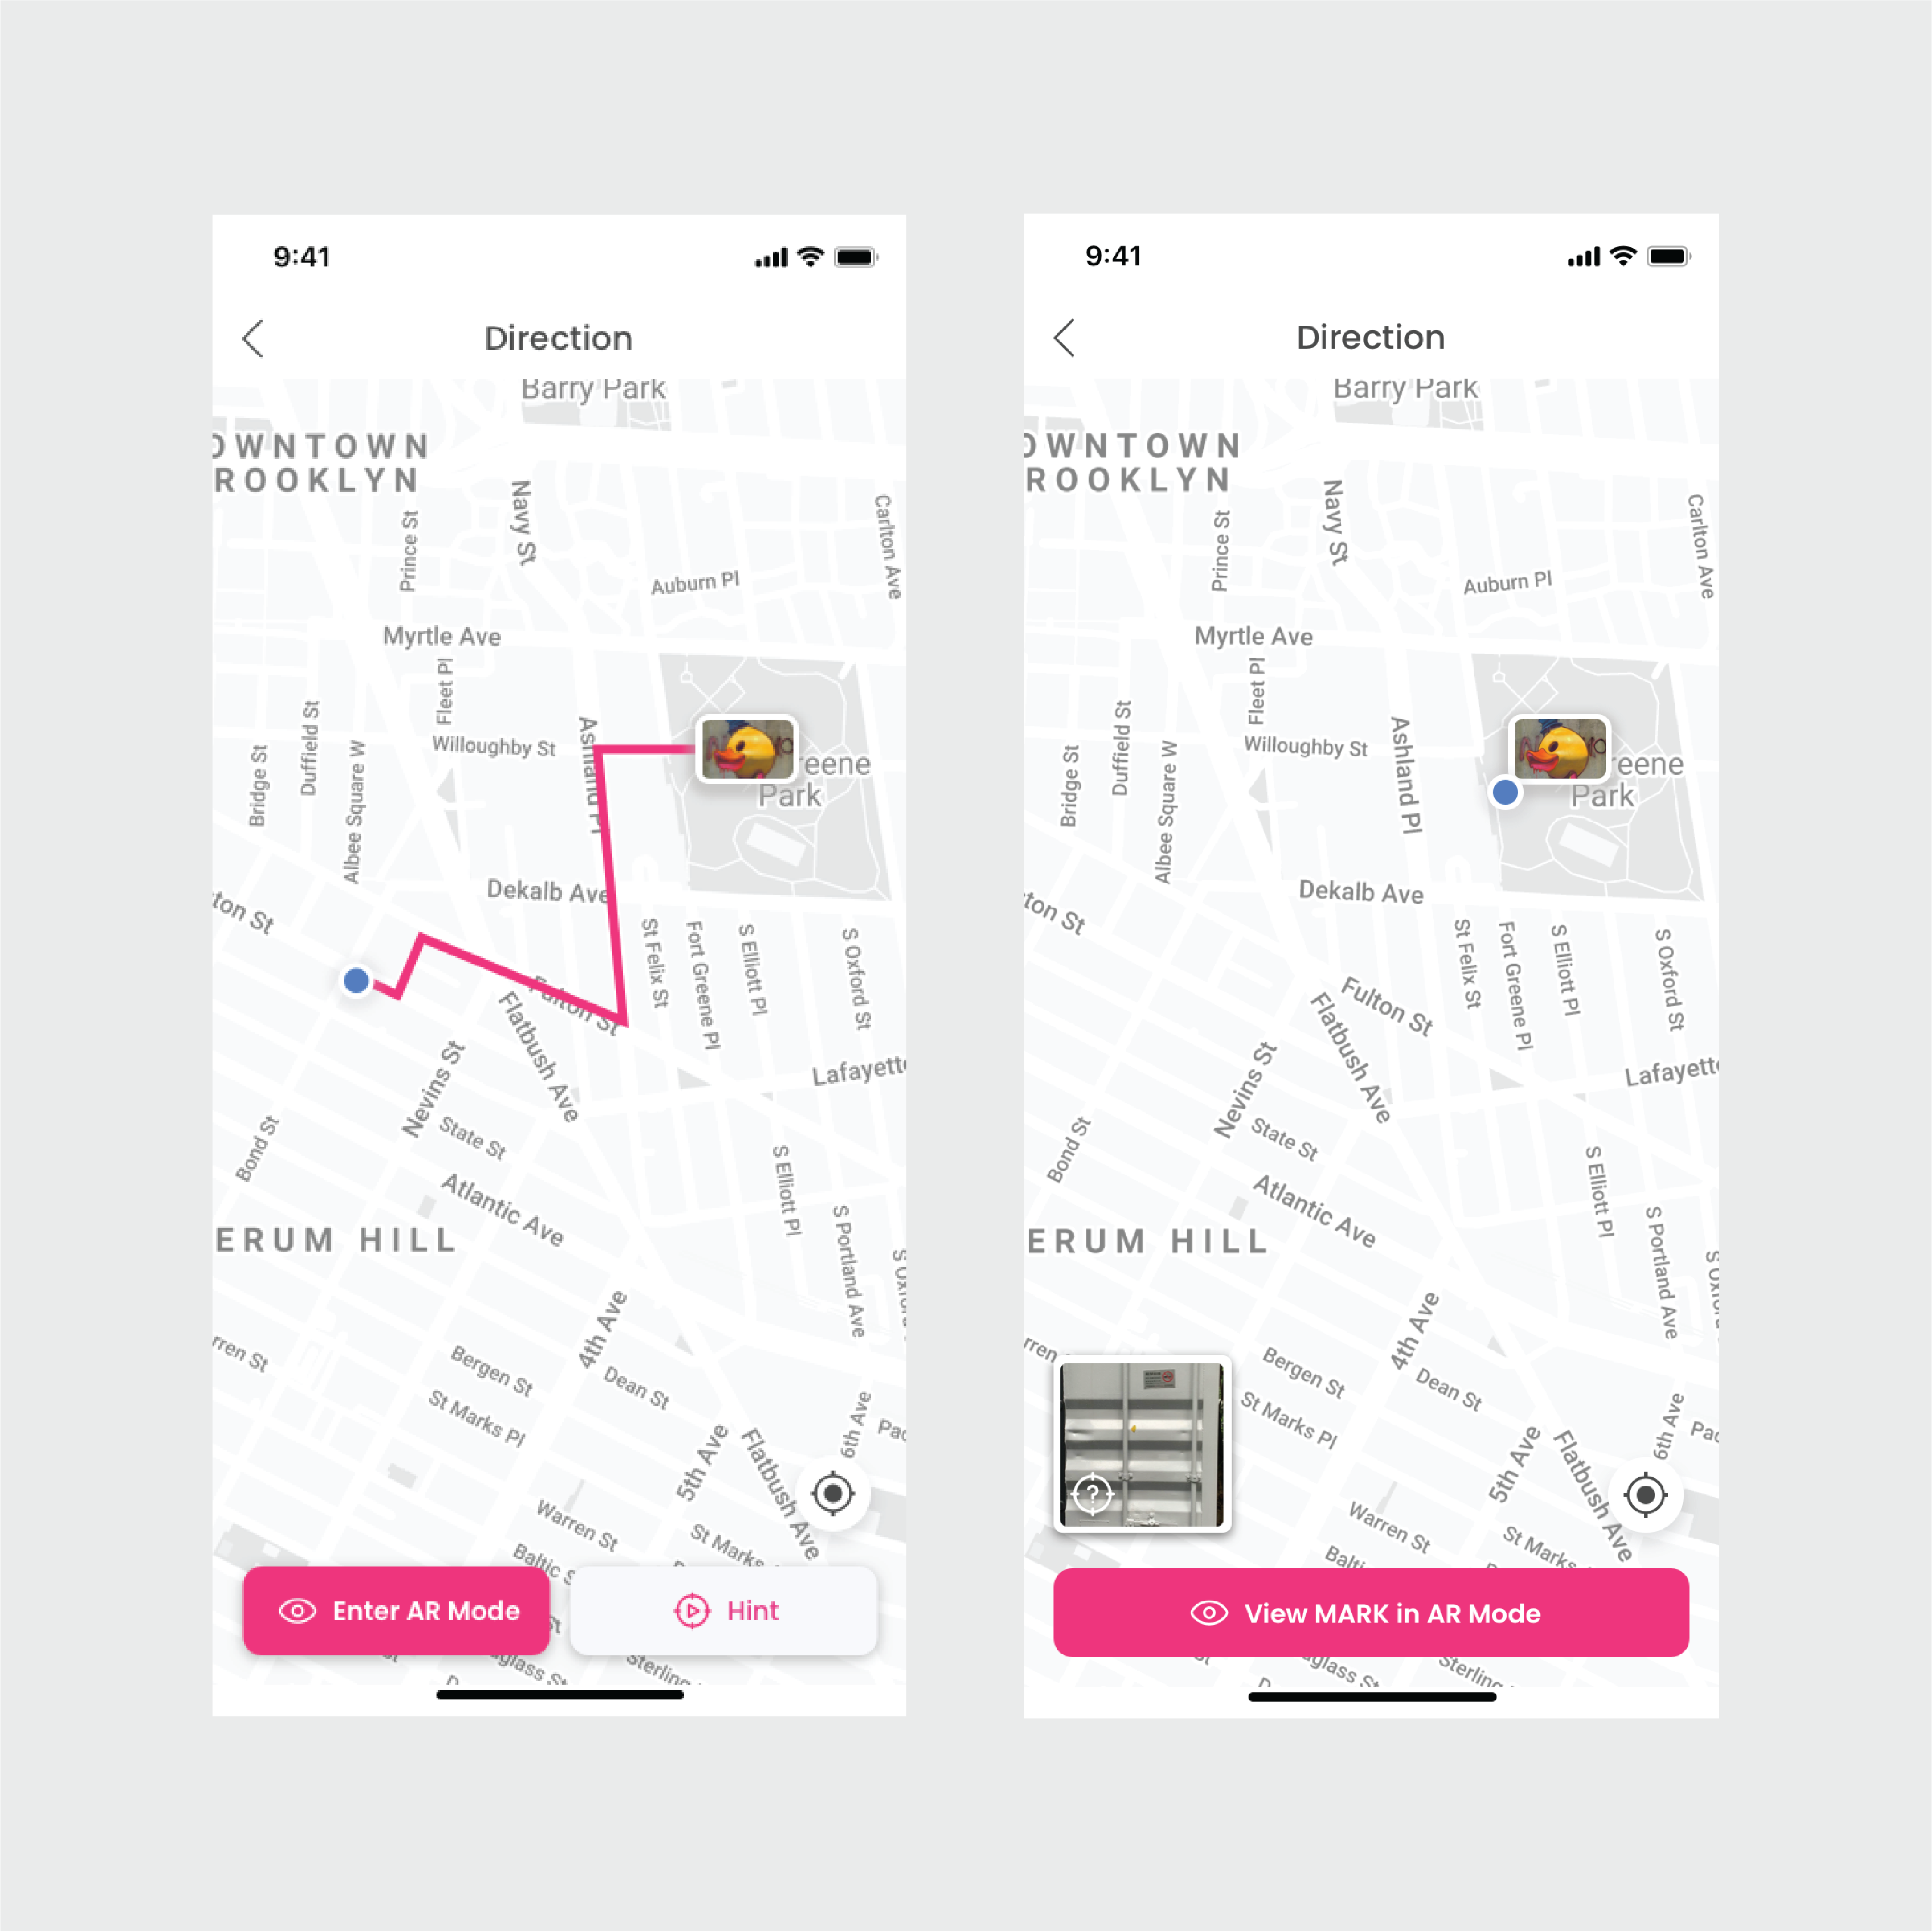
Photo hint feature — visual reference anchors discovery when GPS precision is insufficient
03 — Prototype & Test
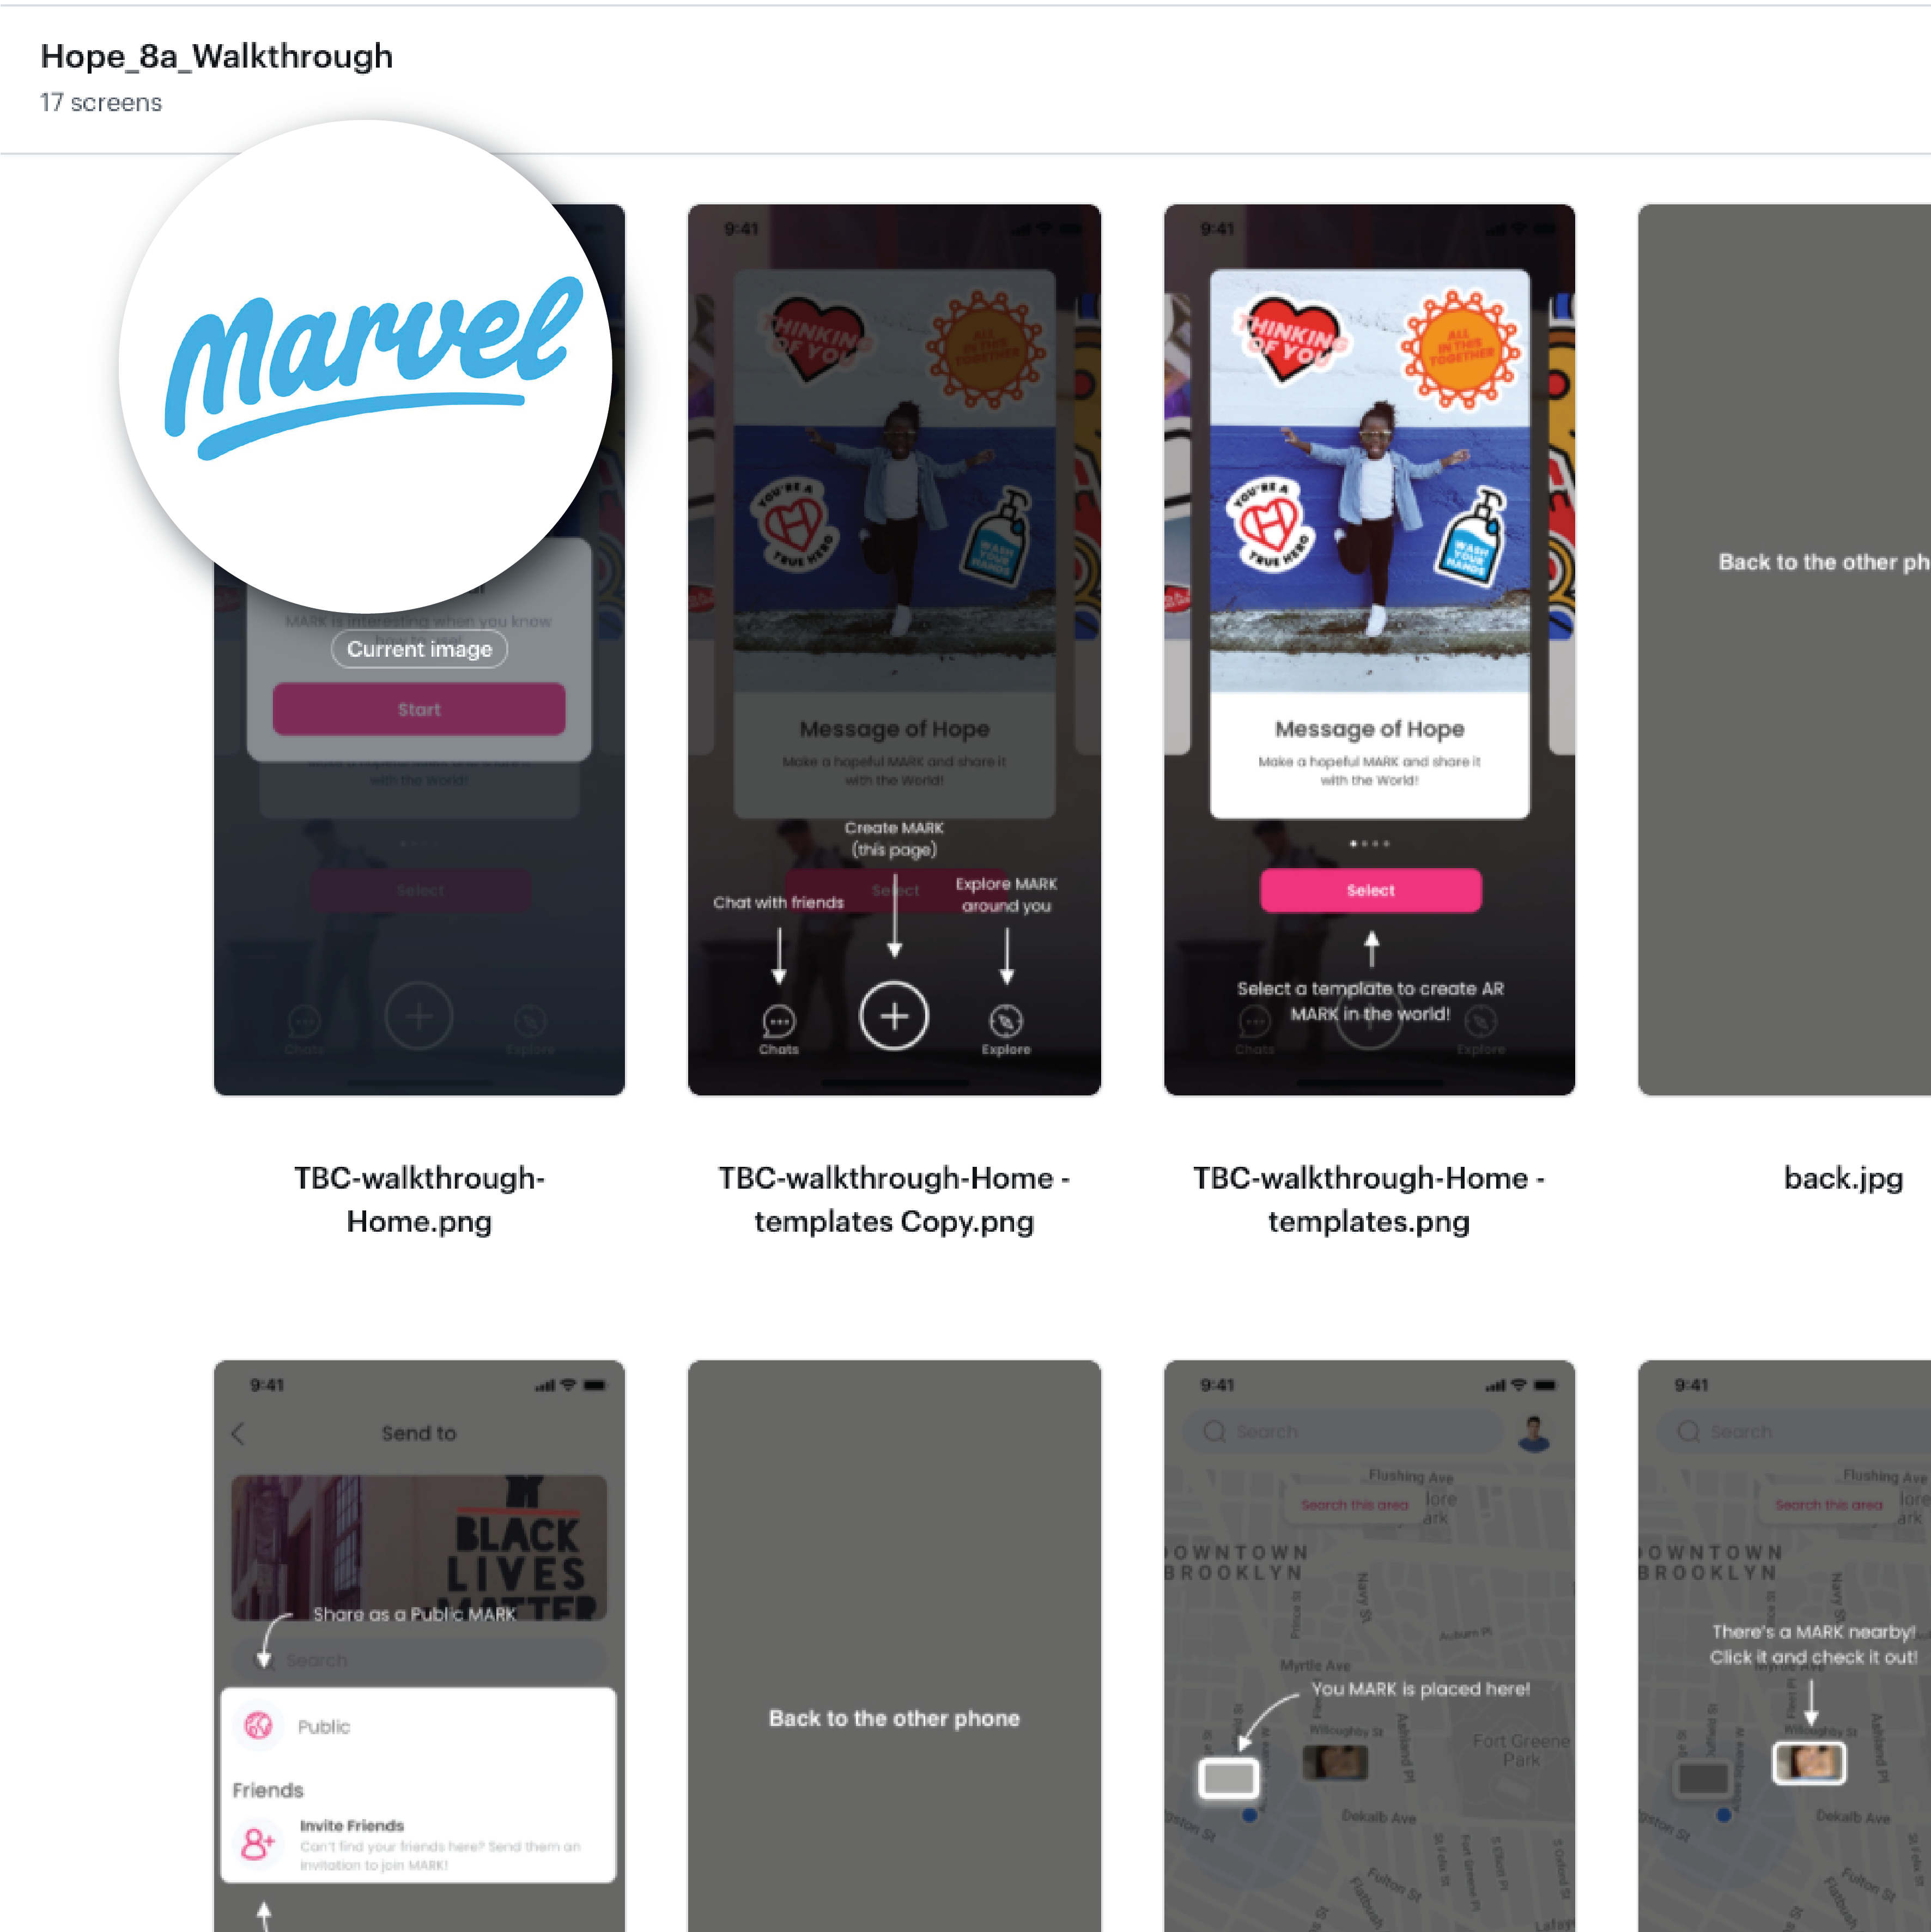
Fast iteration. Qualitative and quantitative in every round.
Prototyping prioritised speed of learning over visual fidelity. Every round combined qualitative user interviews and UAT sessions with quantitative questionnaire data — directional insight and measurable signal in the same sprint. Tools: Marvel for interactive prototypes, Google Slides for lower-fi flows, Google Forms for questionnaires, Google Meet for remote sessions.
Prototype iterations — balancing visual fidelity with speed of learning. Click any image to enlarge.
Testing methodology — qualitative + quantitative mixed approach: individual interviews, group UAT, 5-second test, A/B test, questionnaire
Content Testing
What AR content do users actually want to see — and make?
Content is the core of any social platform. I ran a structured content test to understand two dimensions: what AR content types users would travel to see, and what they found most compelling as a creation format. Cultural and gender biases were explicitly accounted for in the analysis.
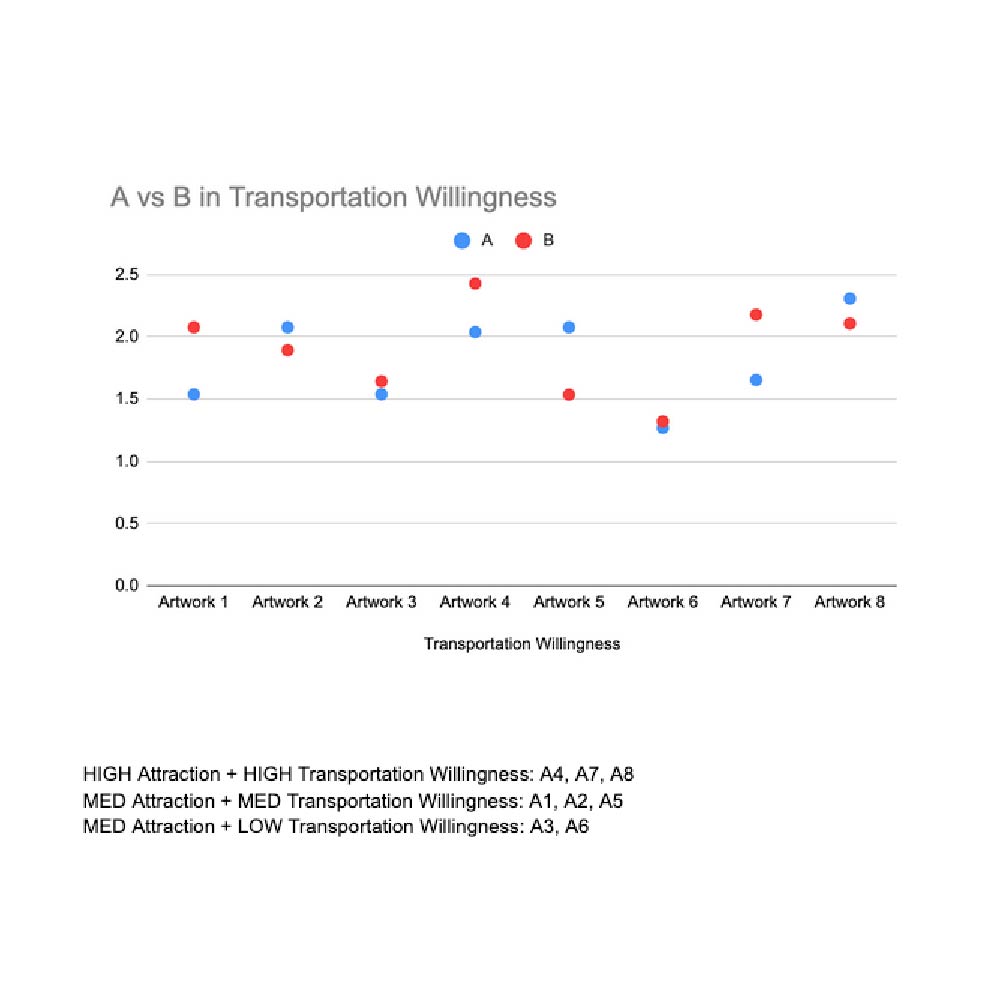
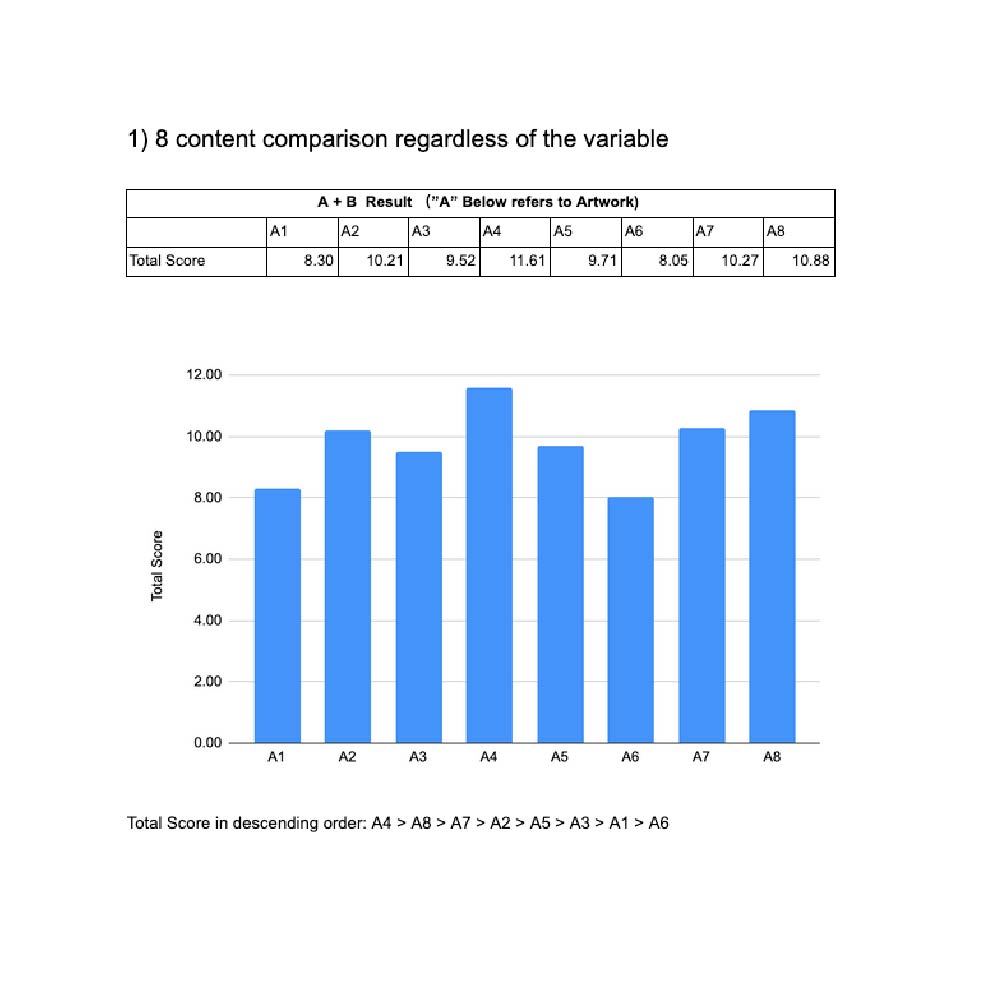
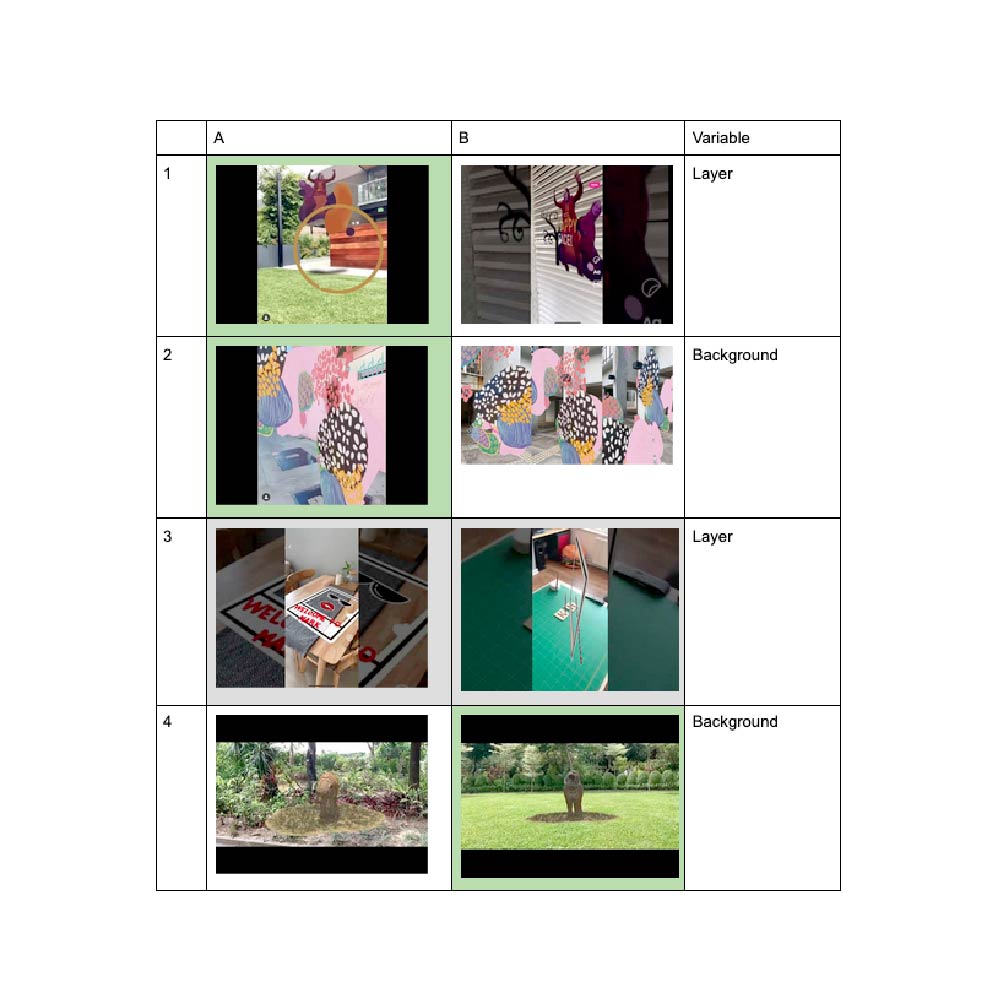
Content test results — transportation willingness vs. attraction levels across AR content types
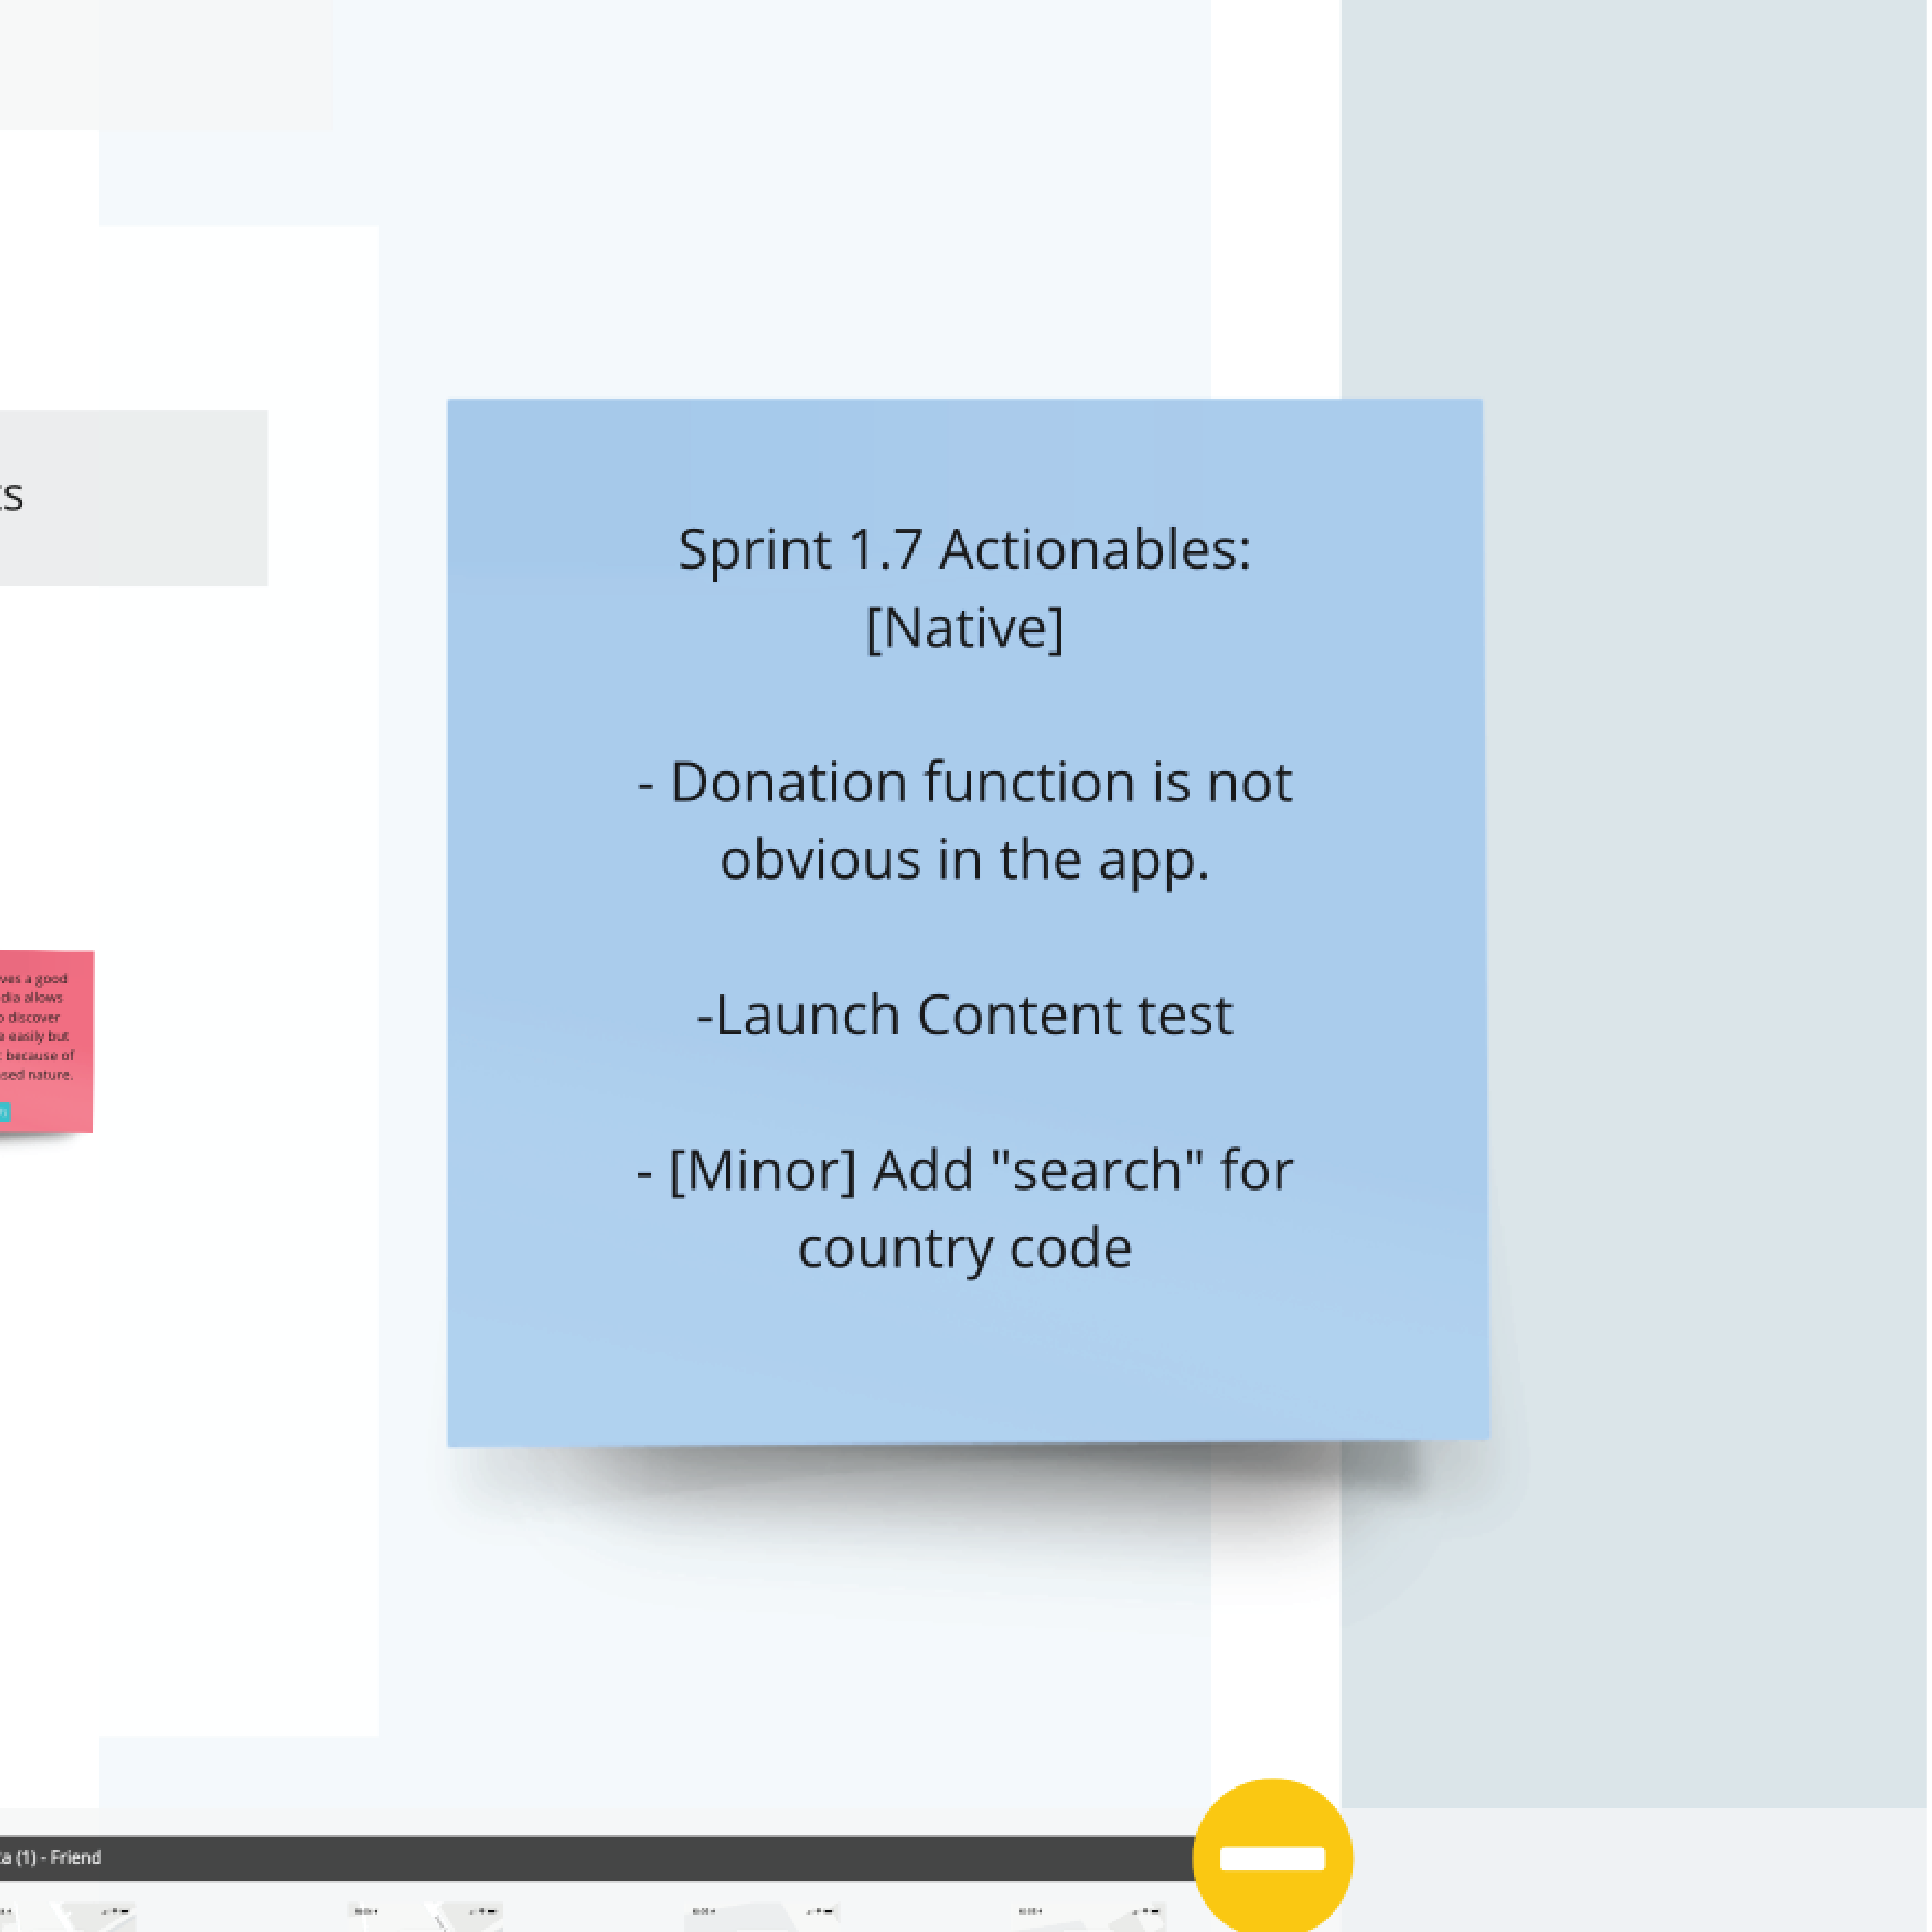
Actionables from Research
Every research session ends with a clear list of next actions — not just observations.
UAT findings and actionables — structured synthesis from every testing round into concrete product decisions
04 — Design Sprint 2.0
The team was building from technology out. Sprint 2.0 reset to user need in.
After Sprint 1, 20% of users still showed no intent to sign up — even with the improved onboarding. The product direction needed a more fundamental rethink. The team had been treating AR technology as the starting point, and building product around it. I proposed a formal Design Sprint 2.0 to reset from user need outward.
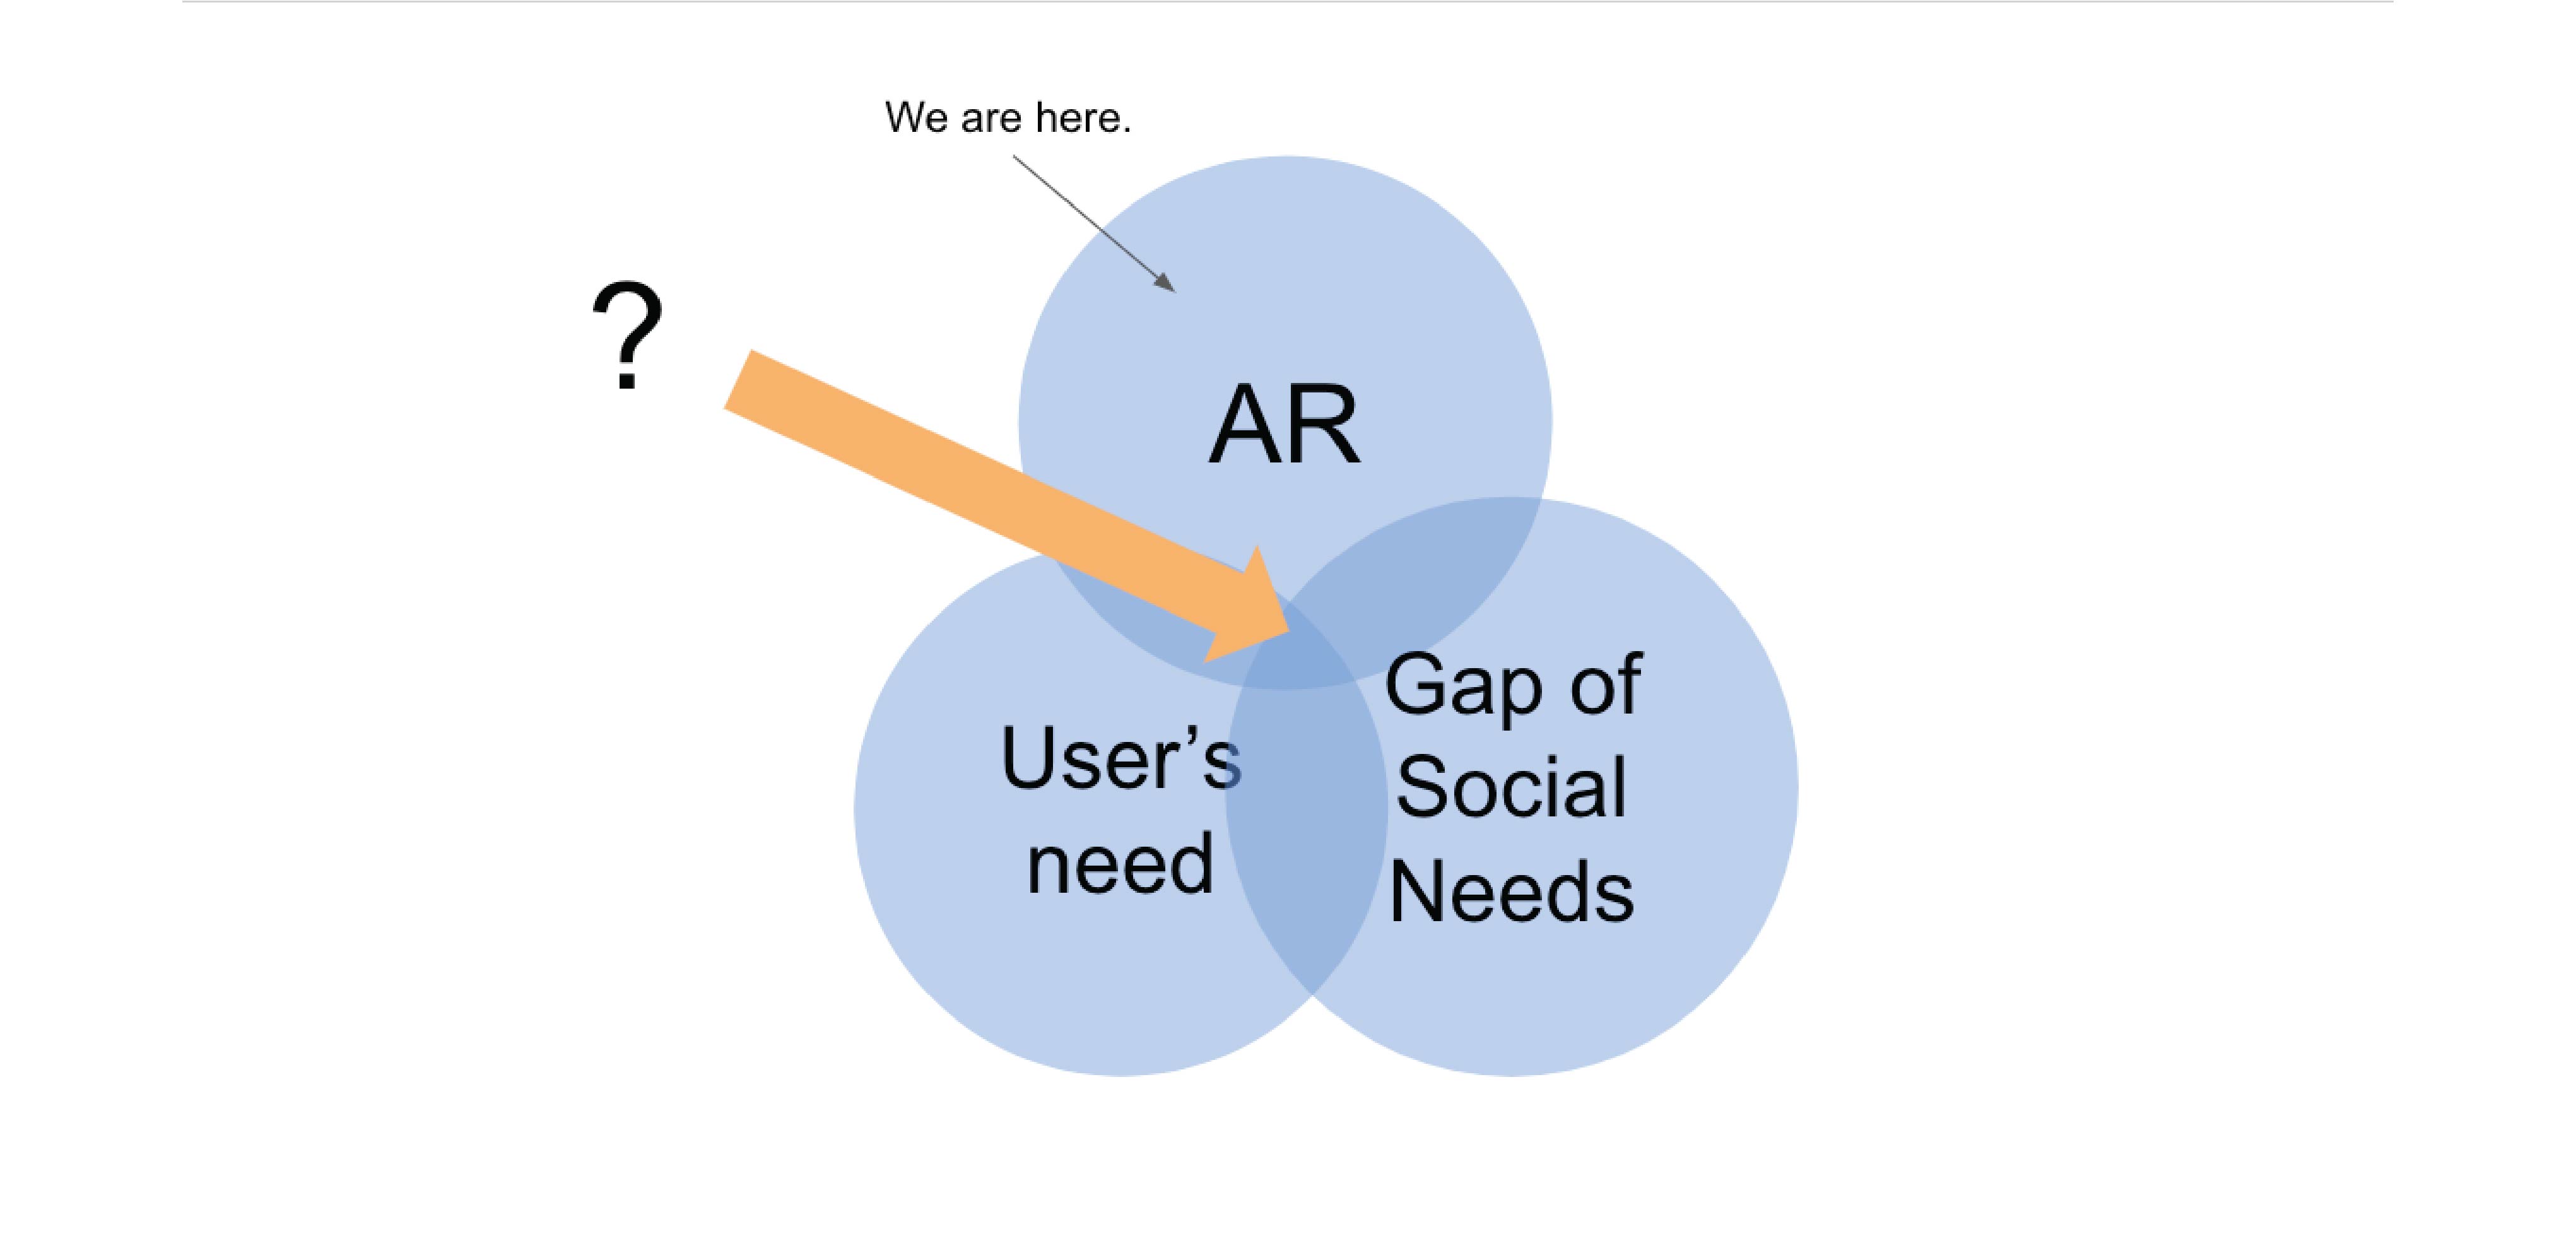
Sprint 2 kickstart — diagnosing the root issue: technology-first product thinking instead of user-need-first
A Design Sprint is a five-phase process — Map, Sketch, Decide, Prototype, Test — designed to reduce risk when exploring new product directions. The process defines the problem, generates and evaluates options, and validates direction with real users before any development commitment.
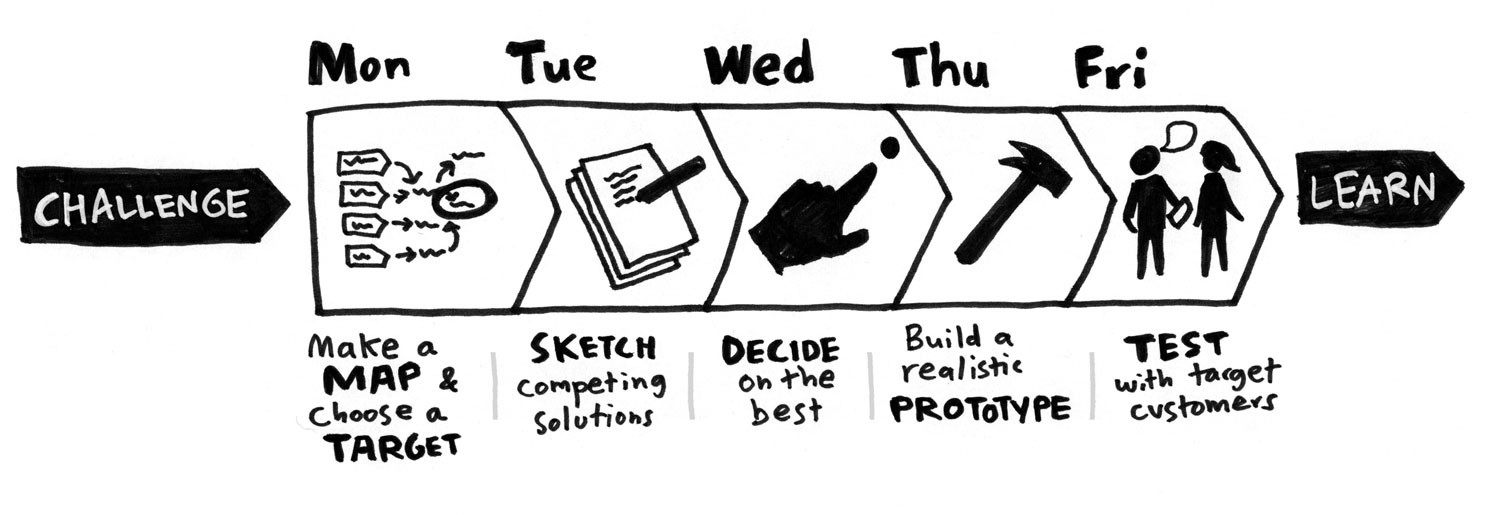
Design Sprint framework — Monday to Friday: Map, Sketch, Decide, Prototype, Test
Monday–Wednesday: Map, Sketch, Decide
Define the problem. Generate options. Converge on the best solution.
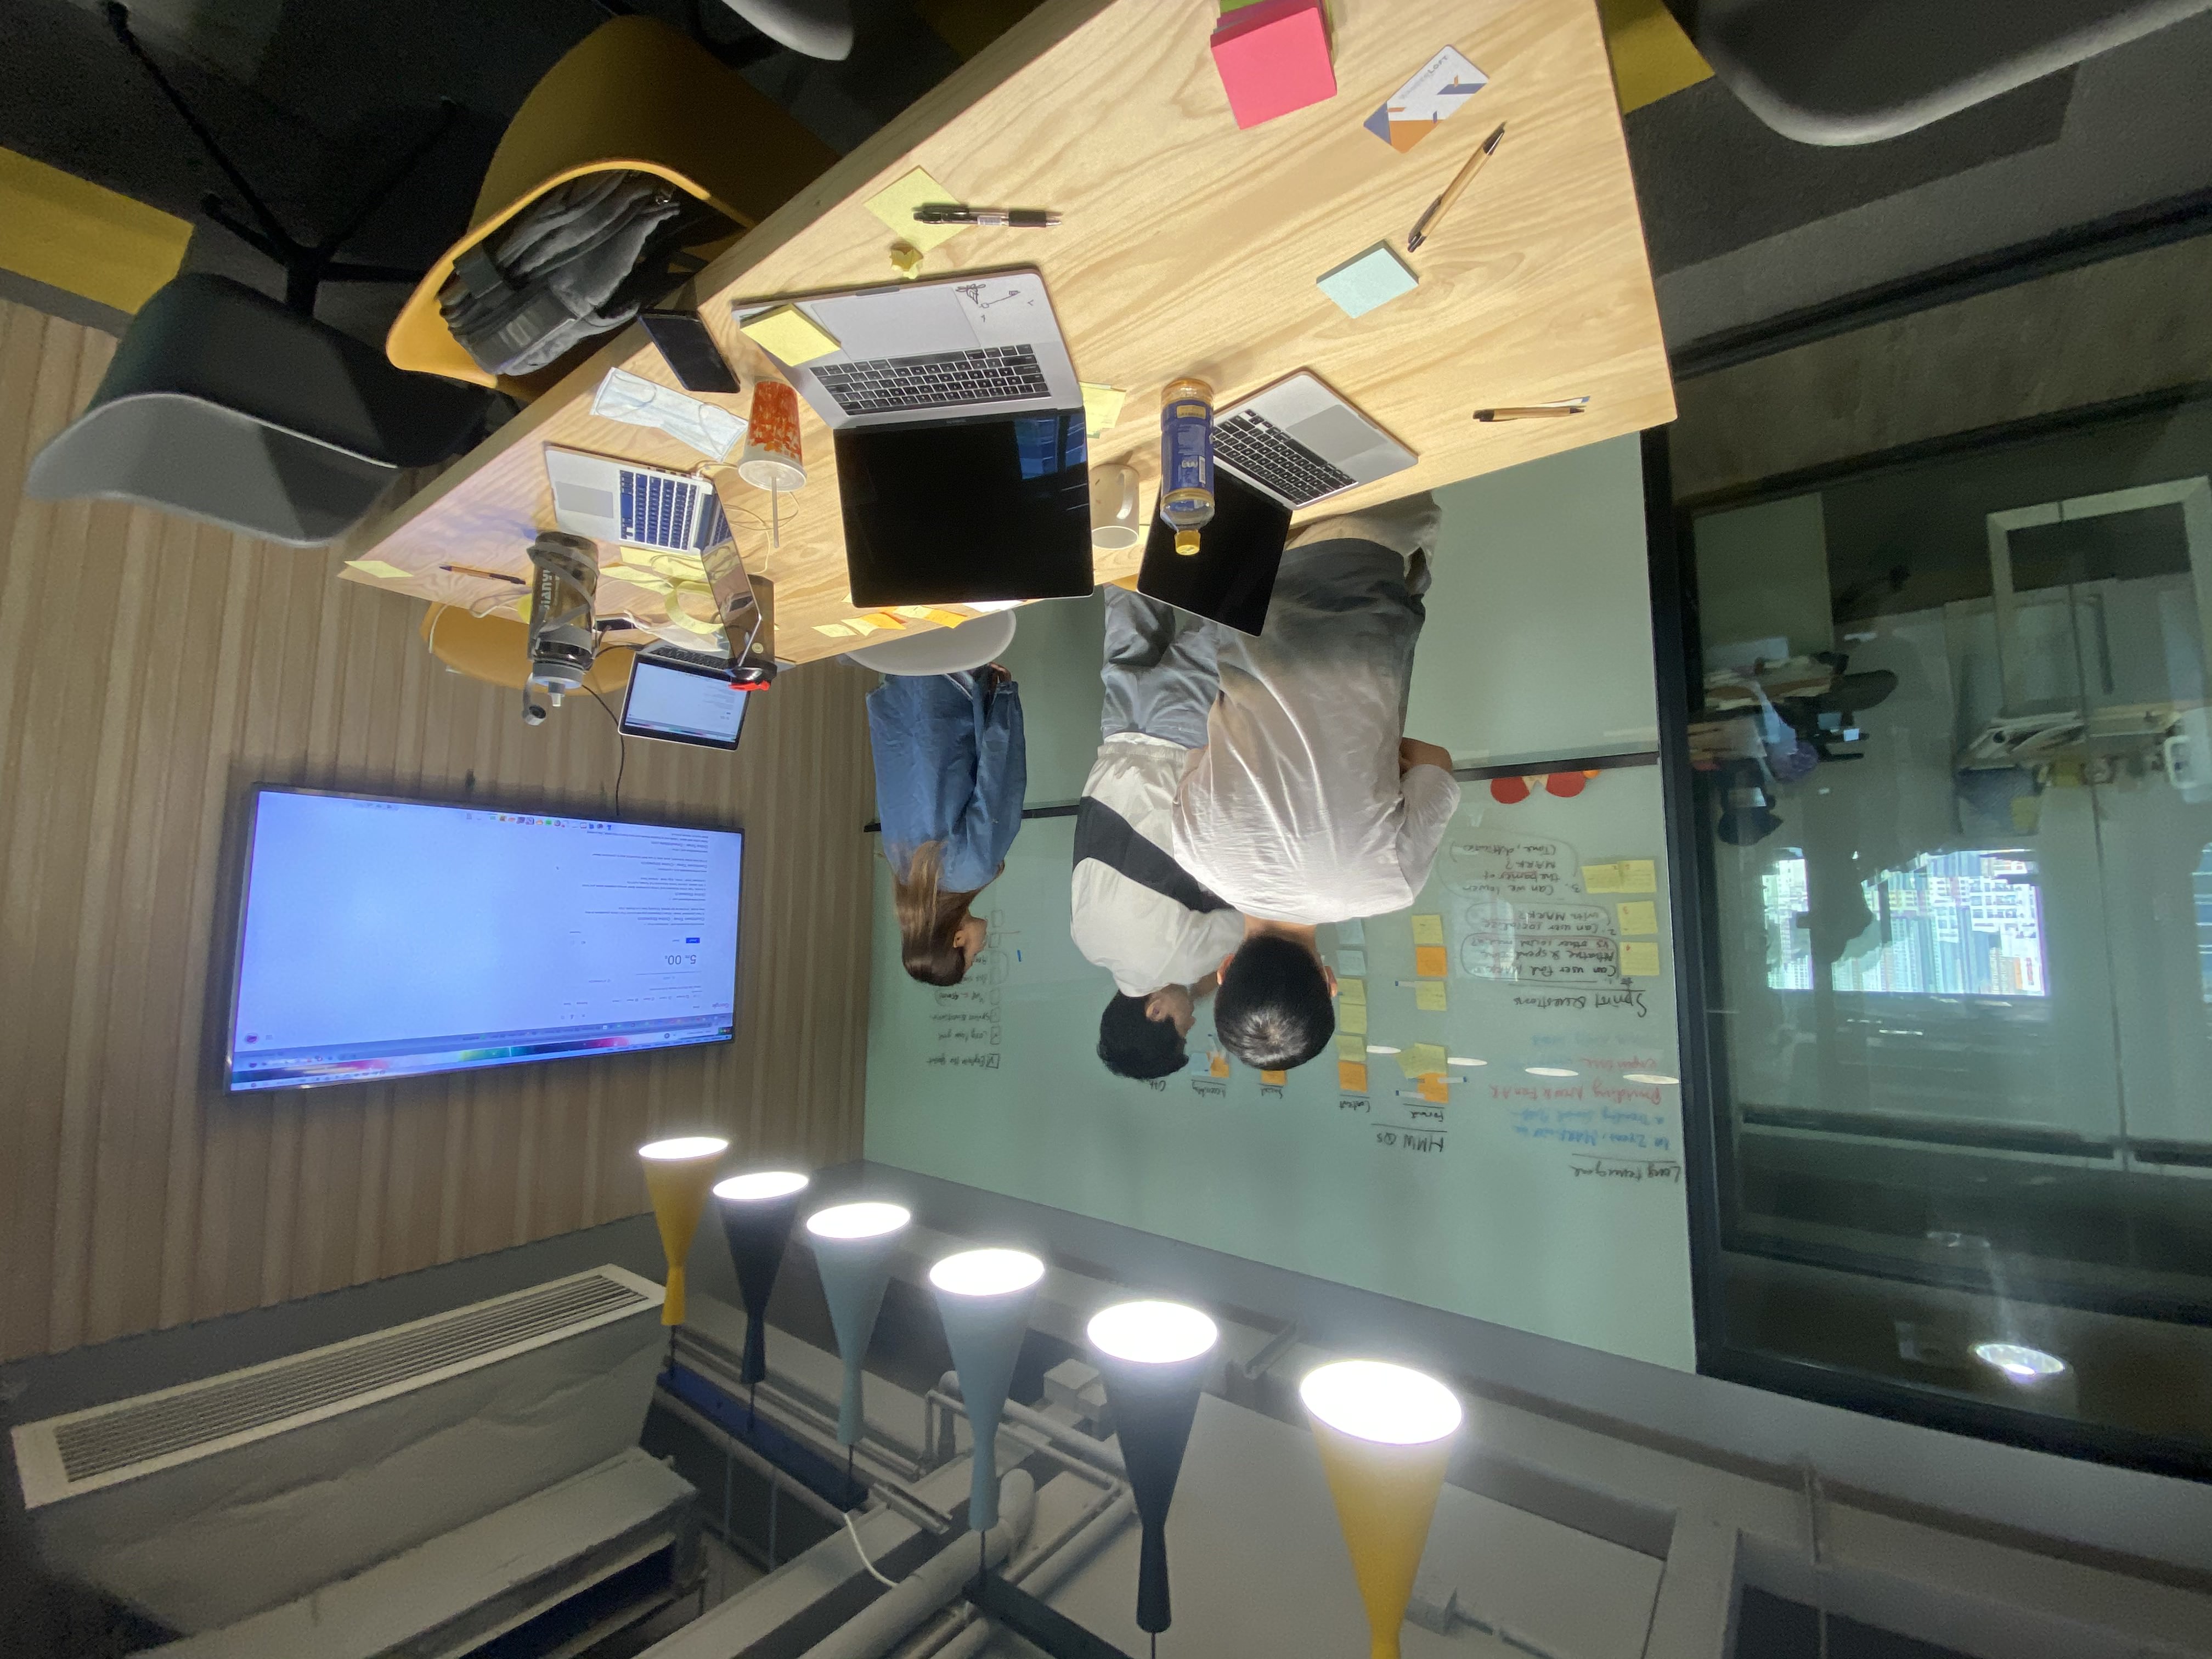
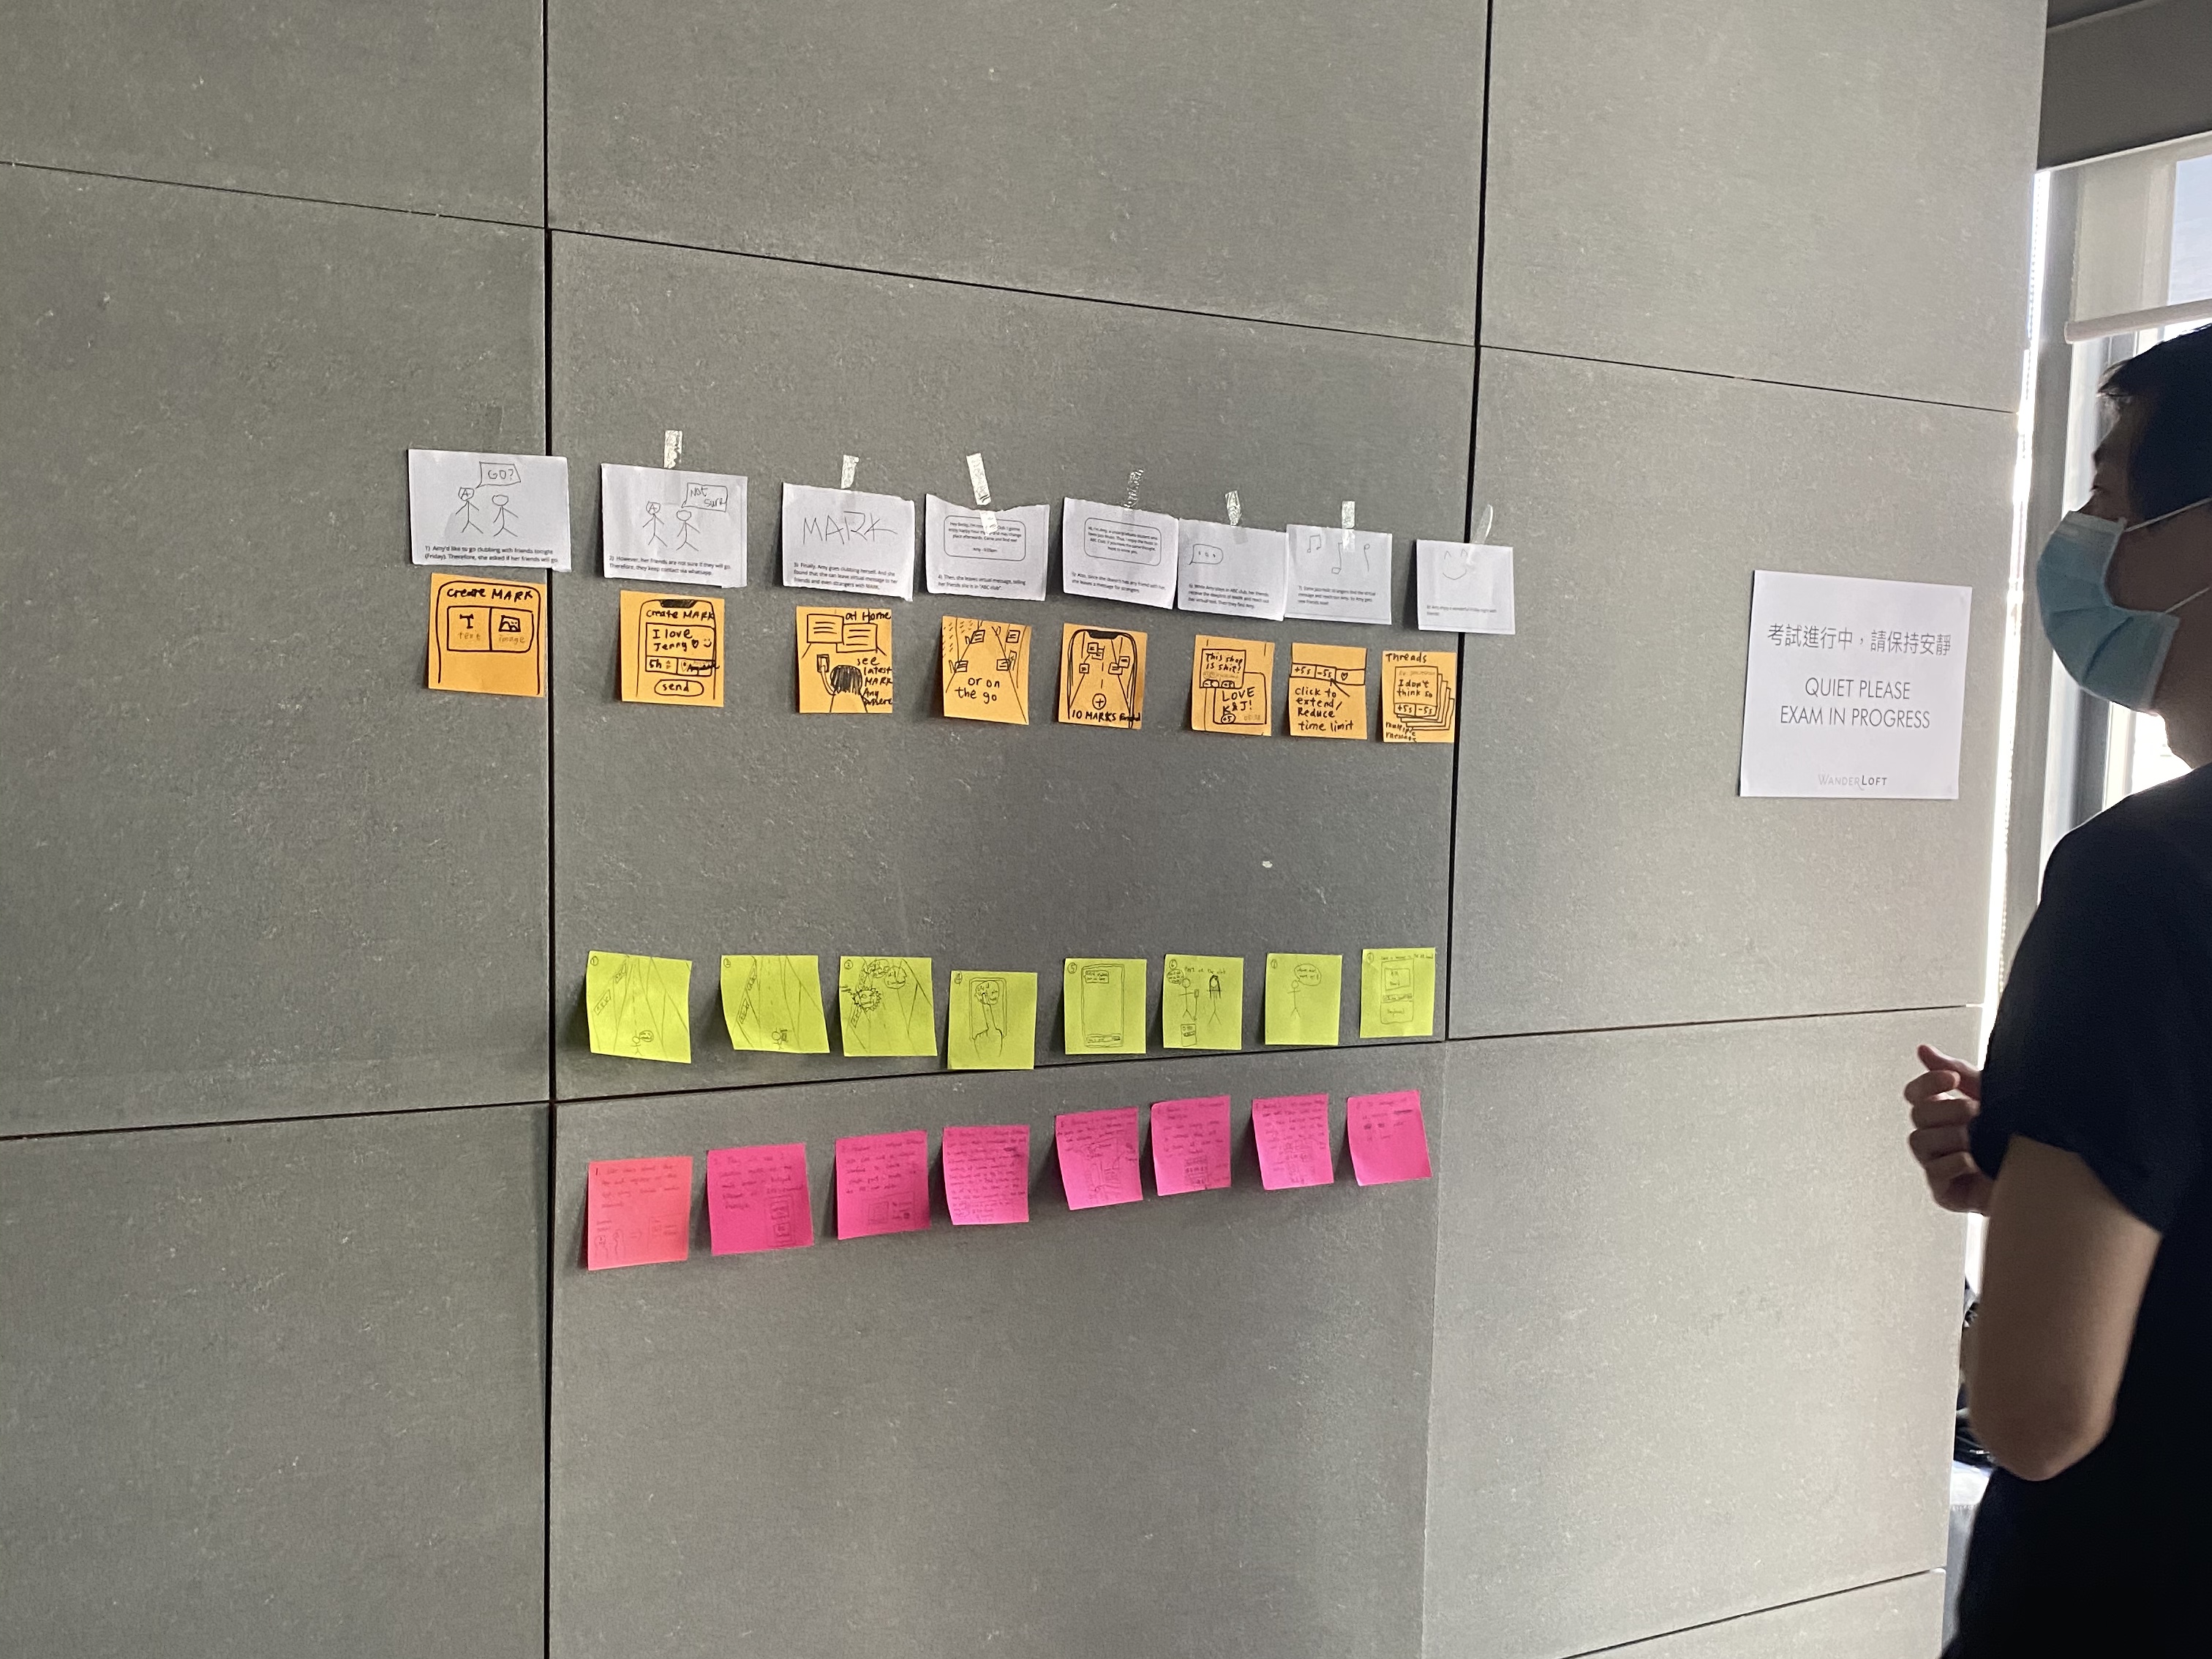
Map → Sketch → Decide — problem mapping, solution generation, and structured decision-making (Mon–Wed). Click to enlarge.
Thursday–Friday: Prototype & Test
Build enough to test. Test with real users. Know the answer by Friday.
Sprint prototype testing — validated product direction with users before any development commitment
Sprint Outcome Screens
Sprint 2.0 validated outcome screens — product direction for next development cycle. Click to enlarge.
Product Demo
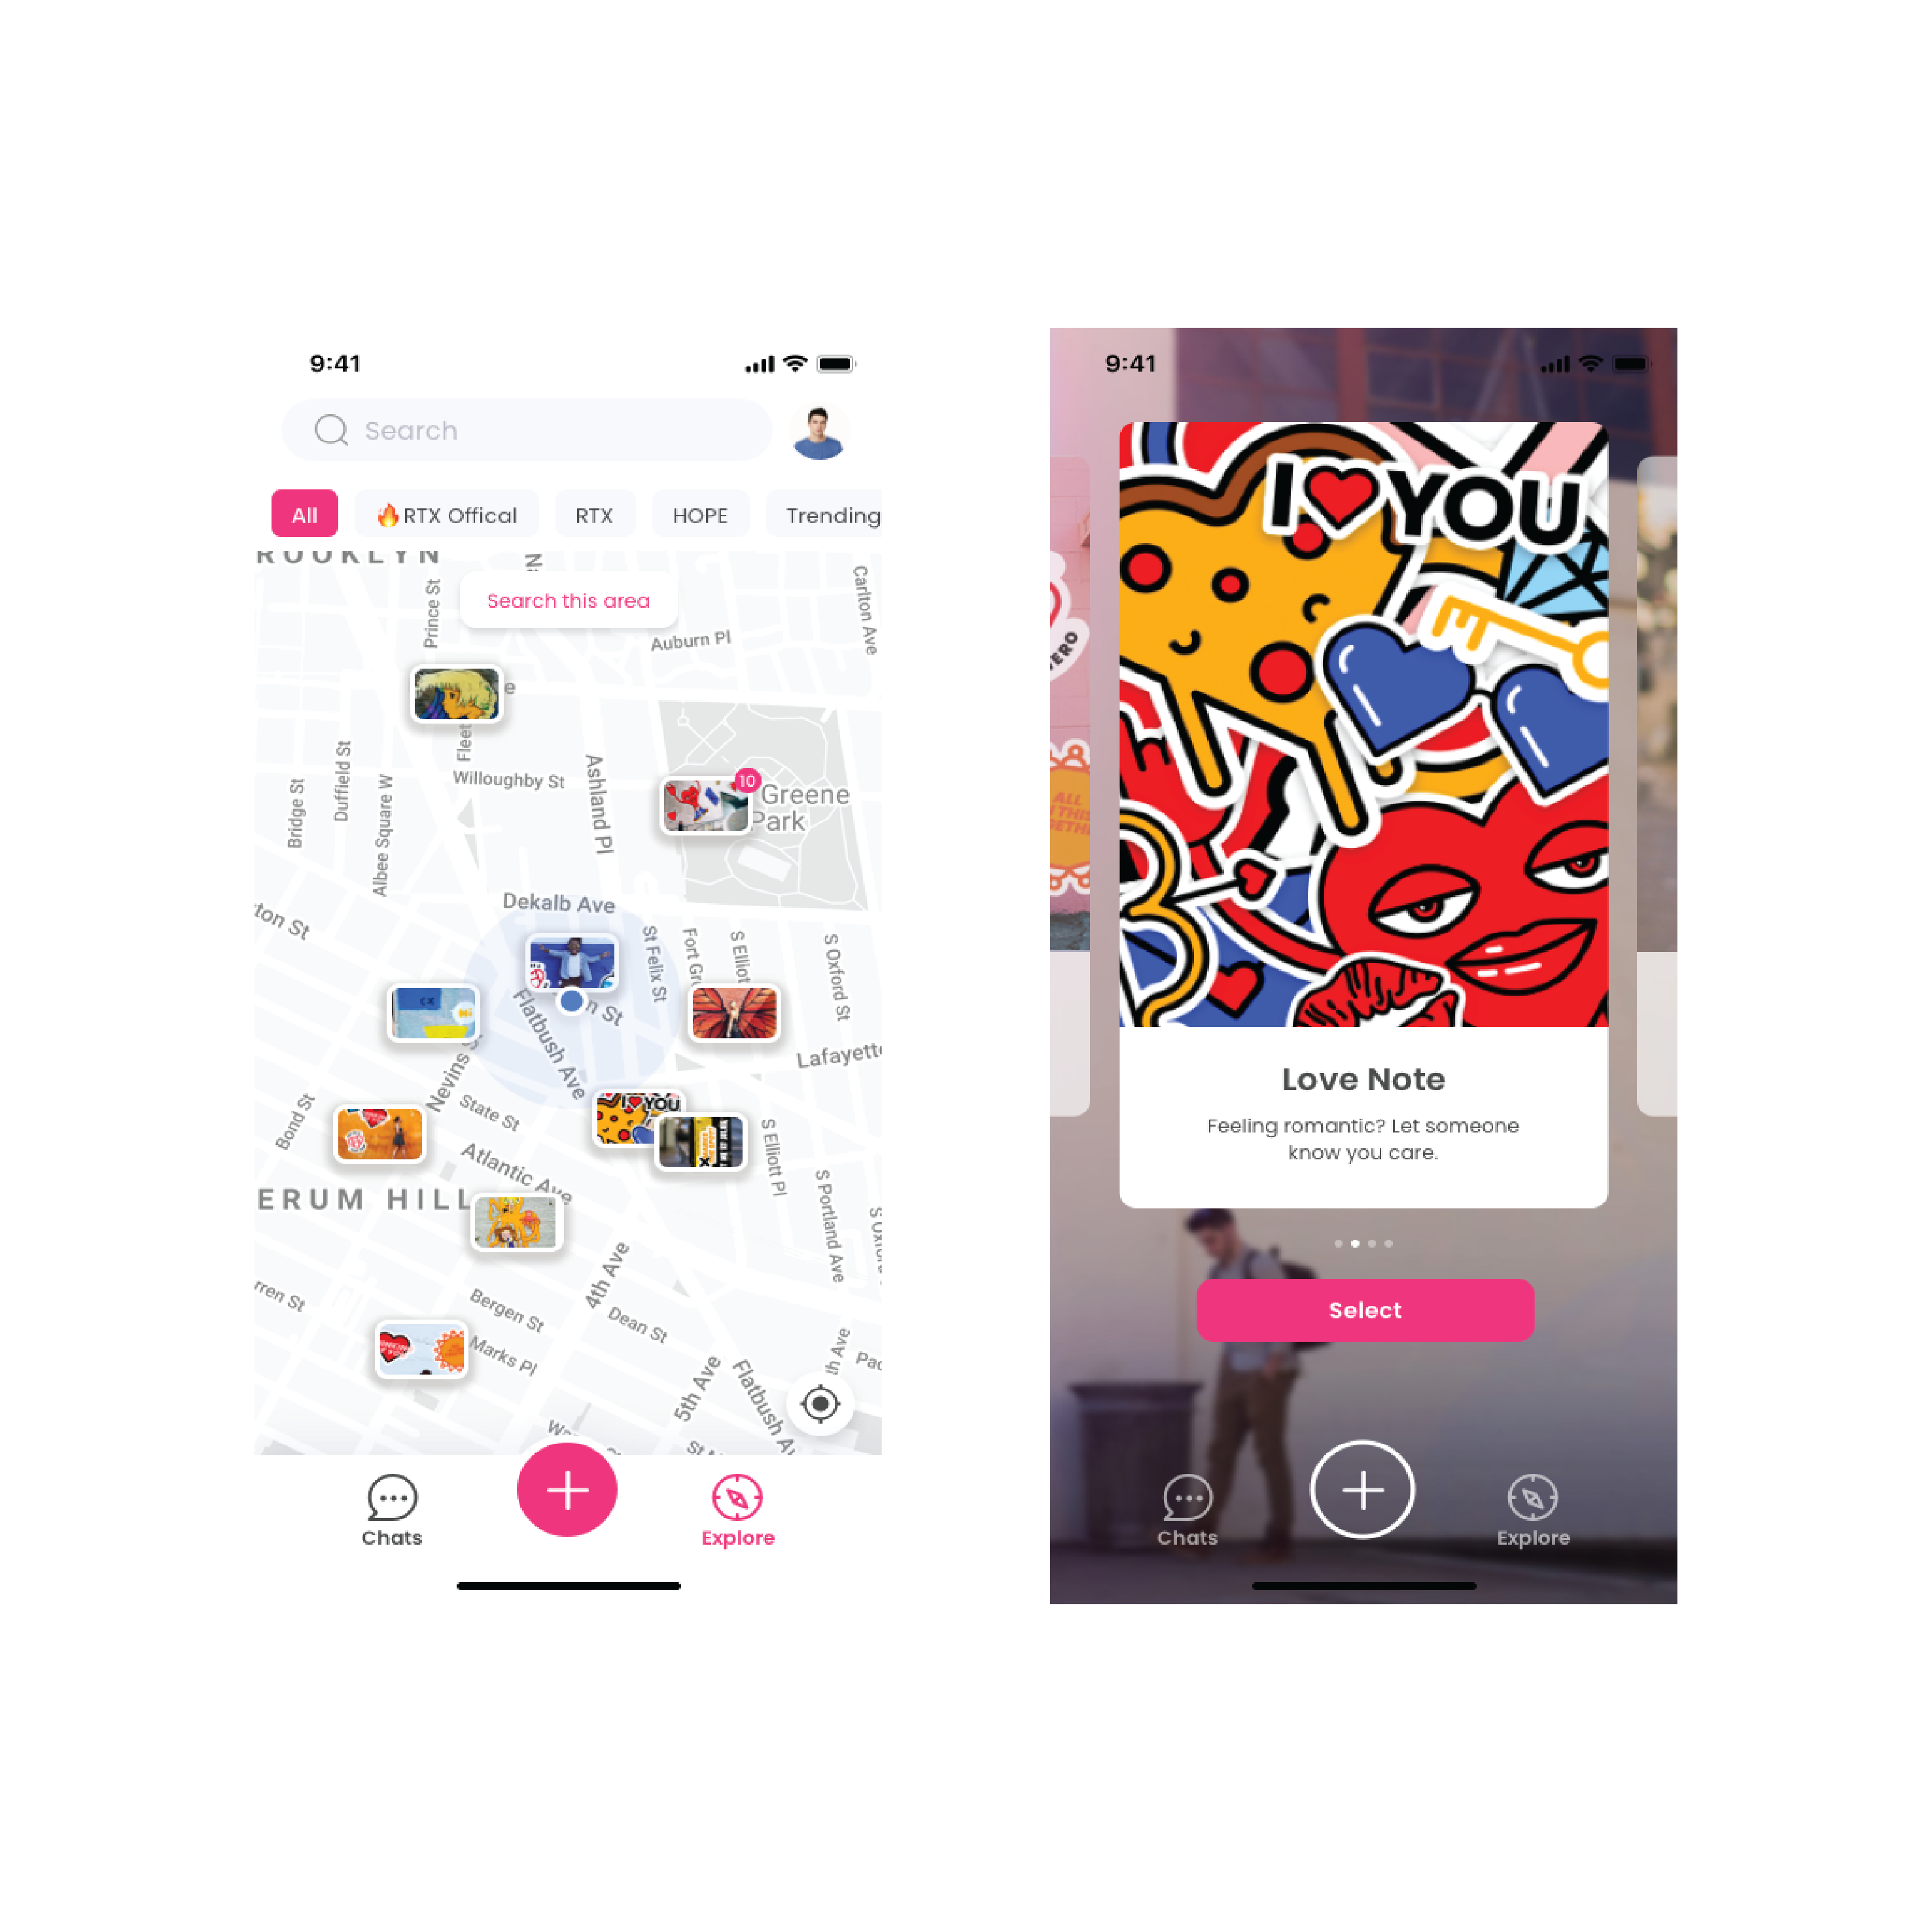
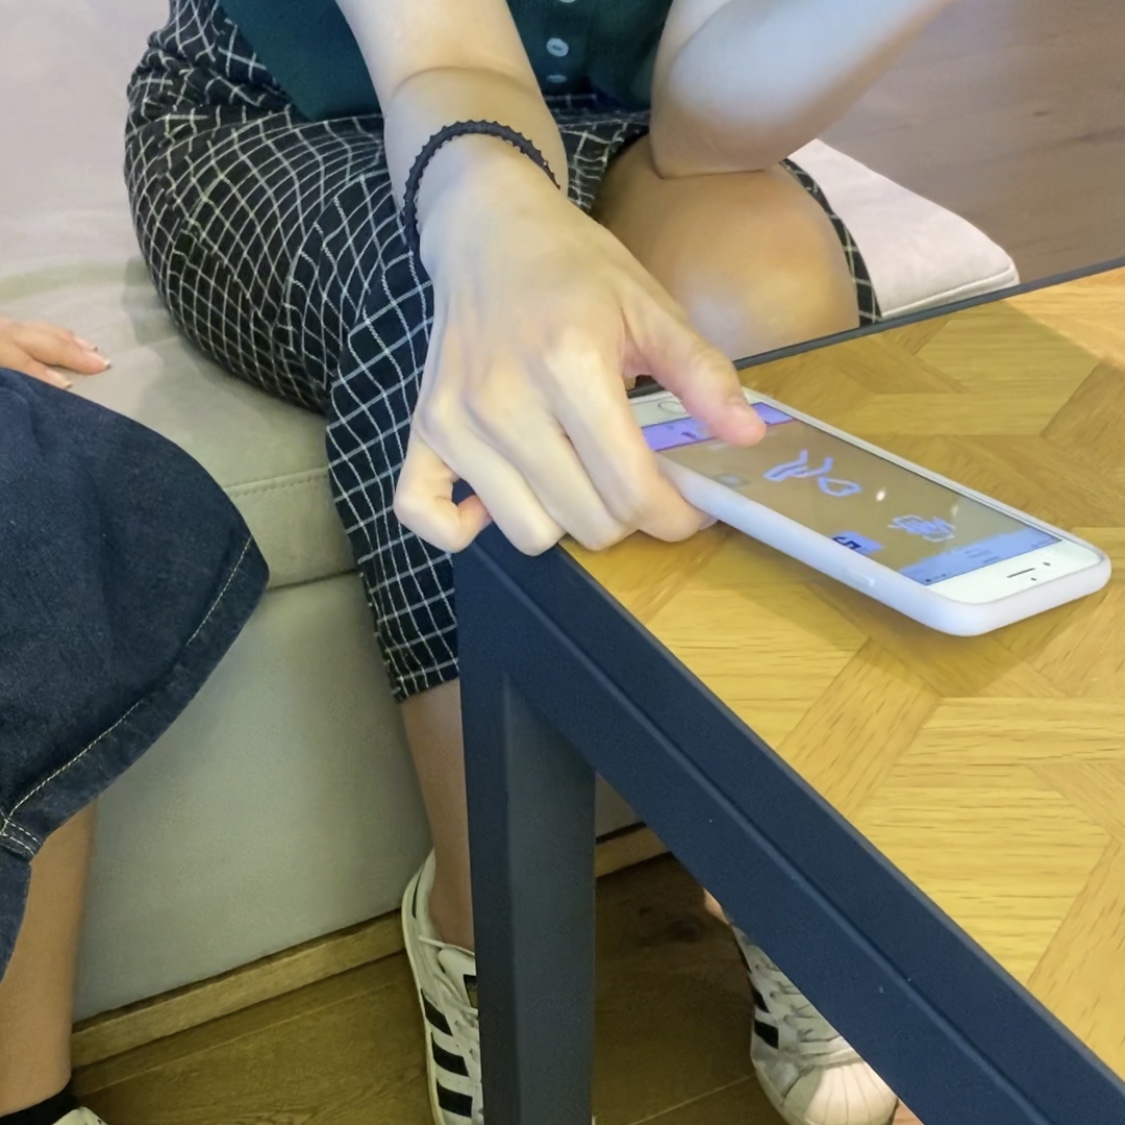
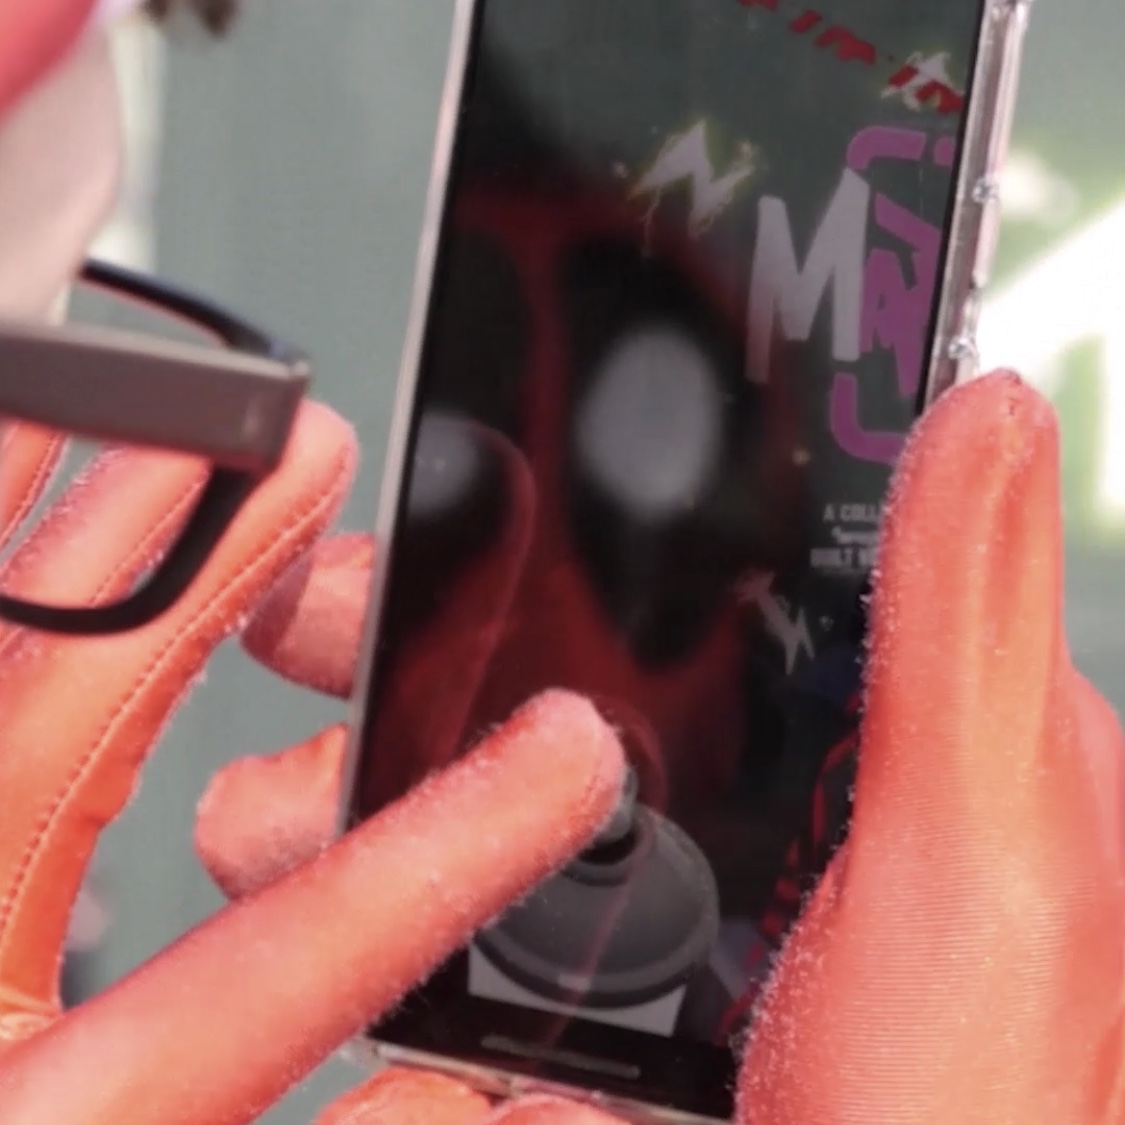
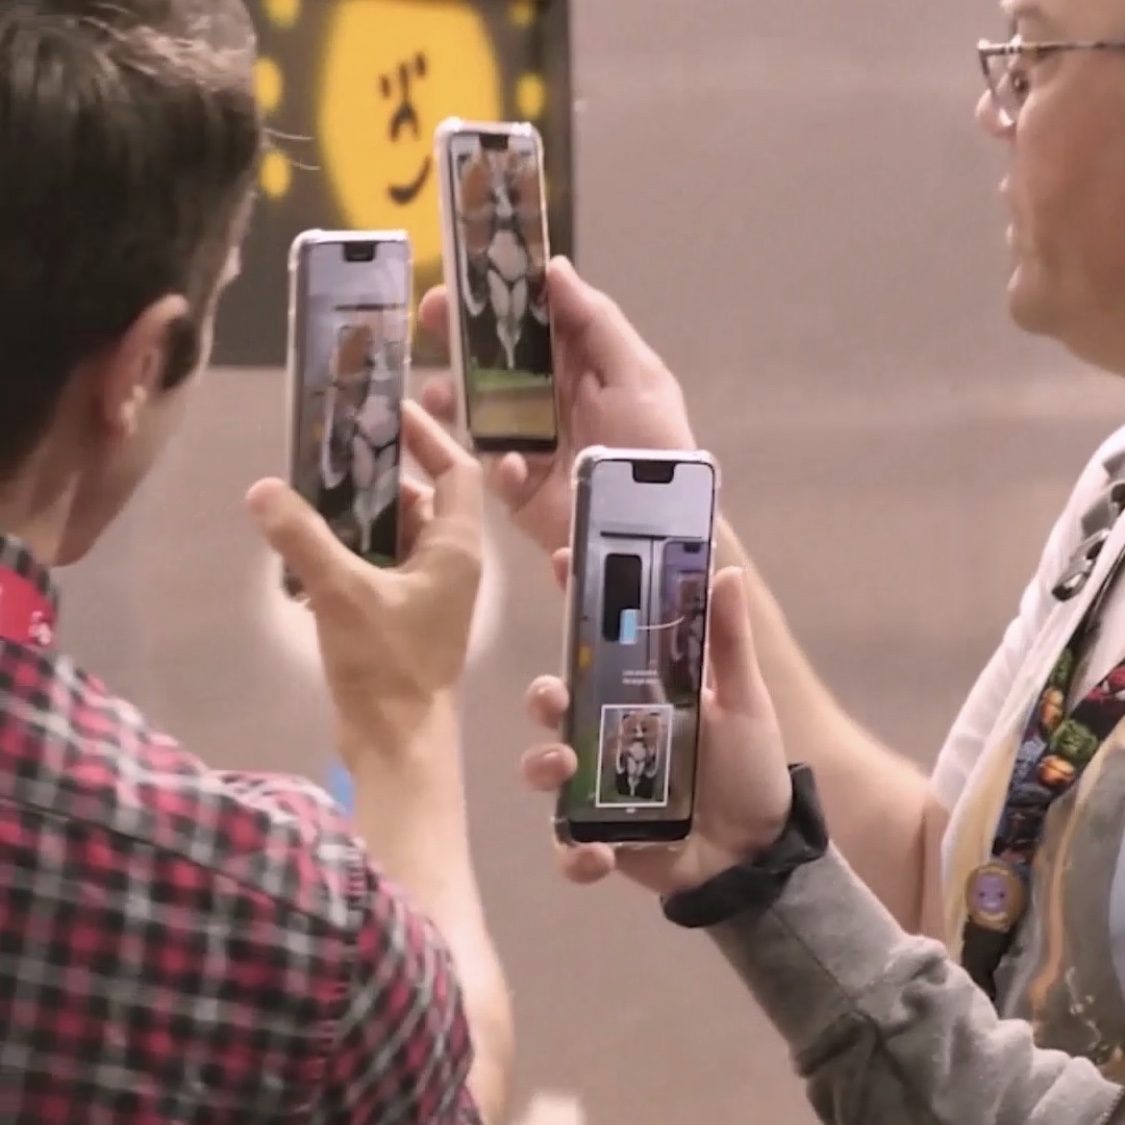
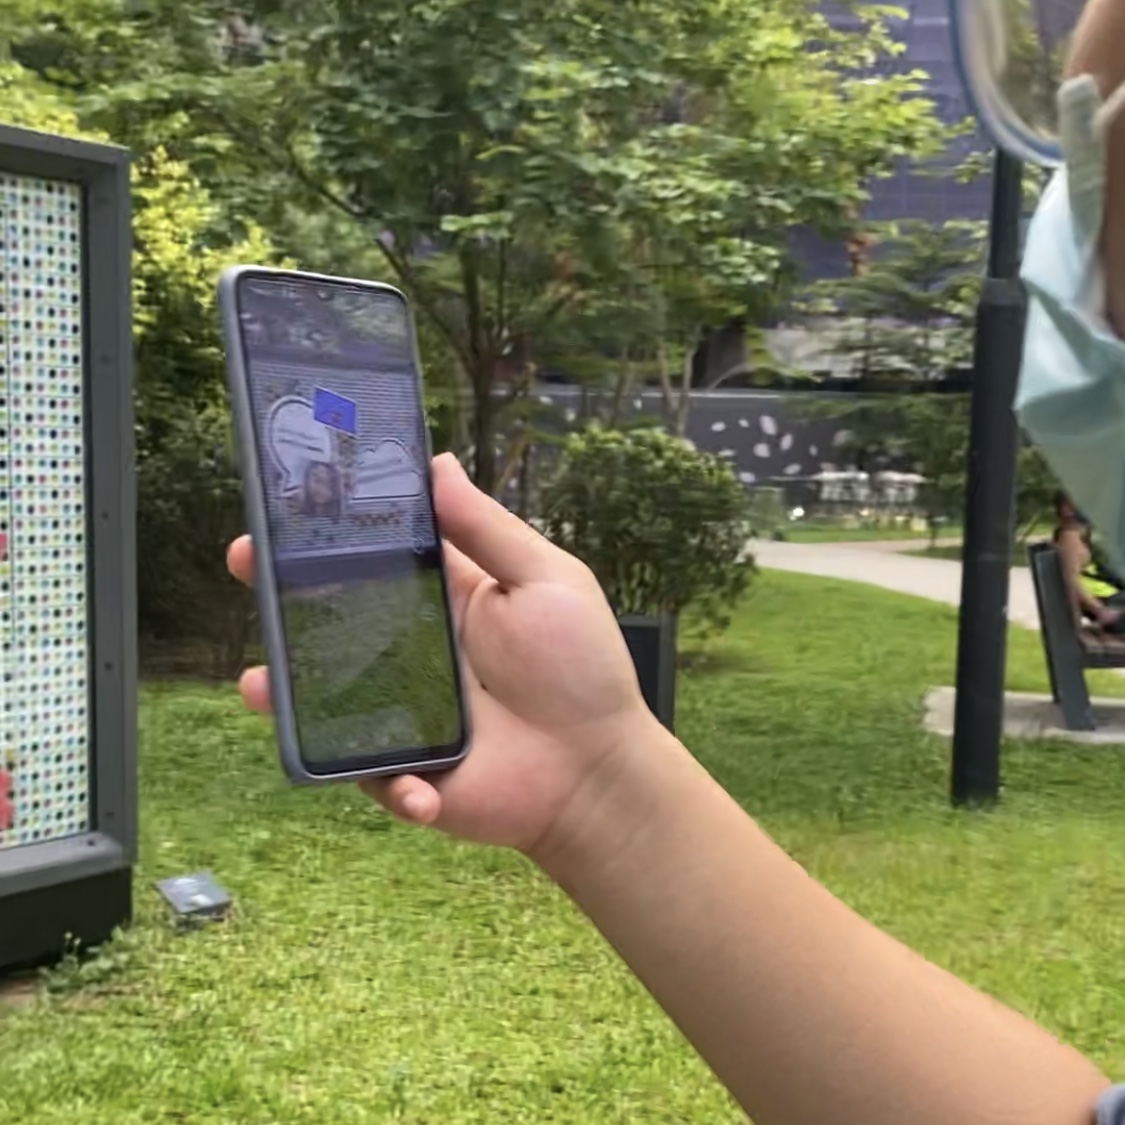
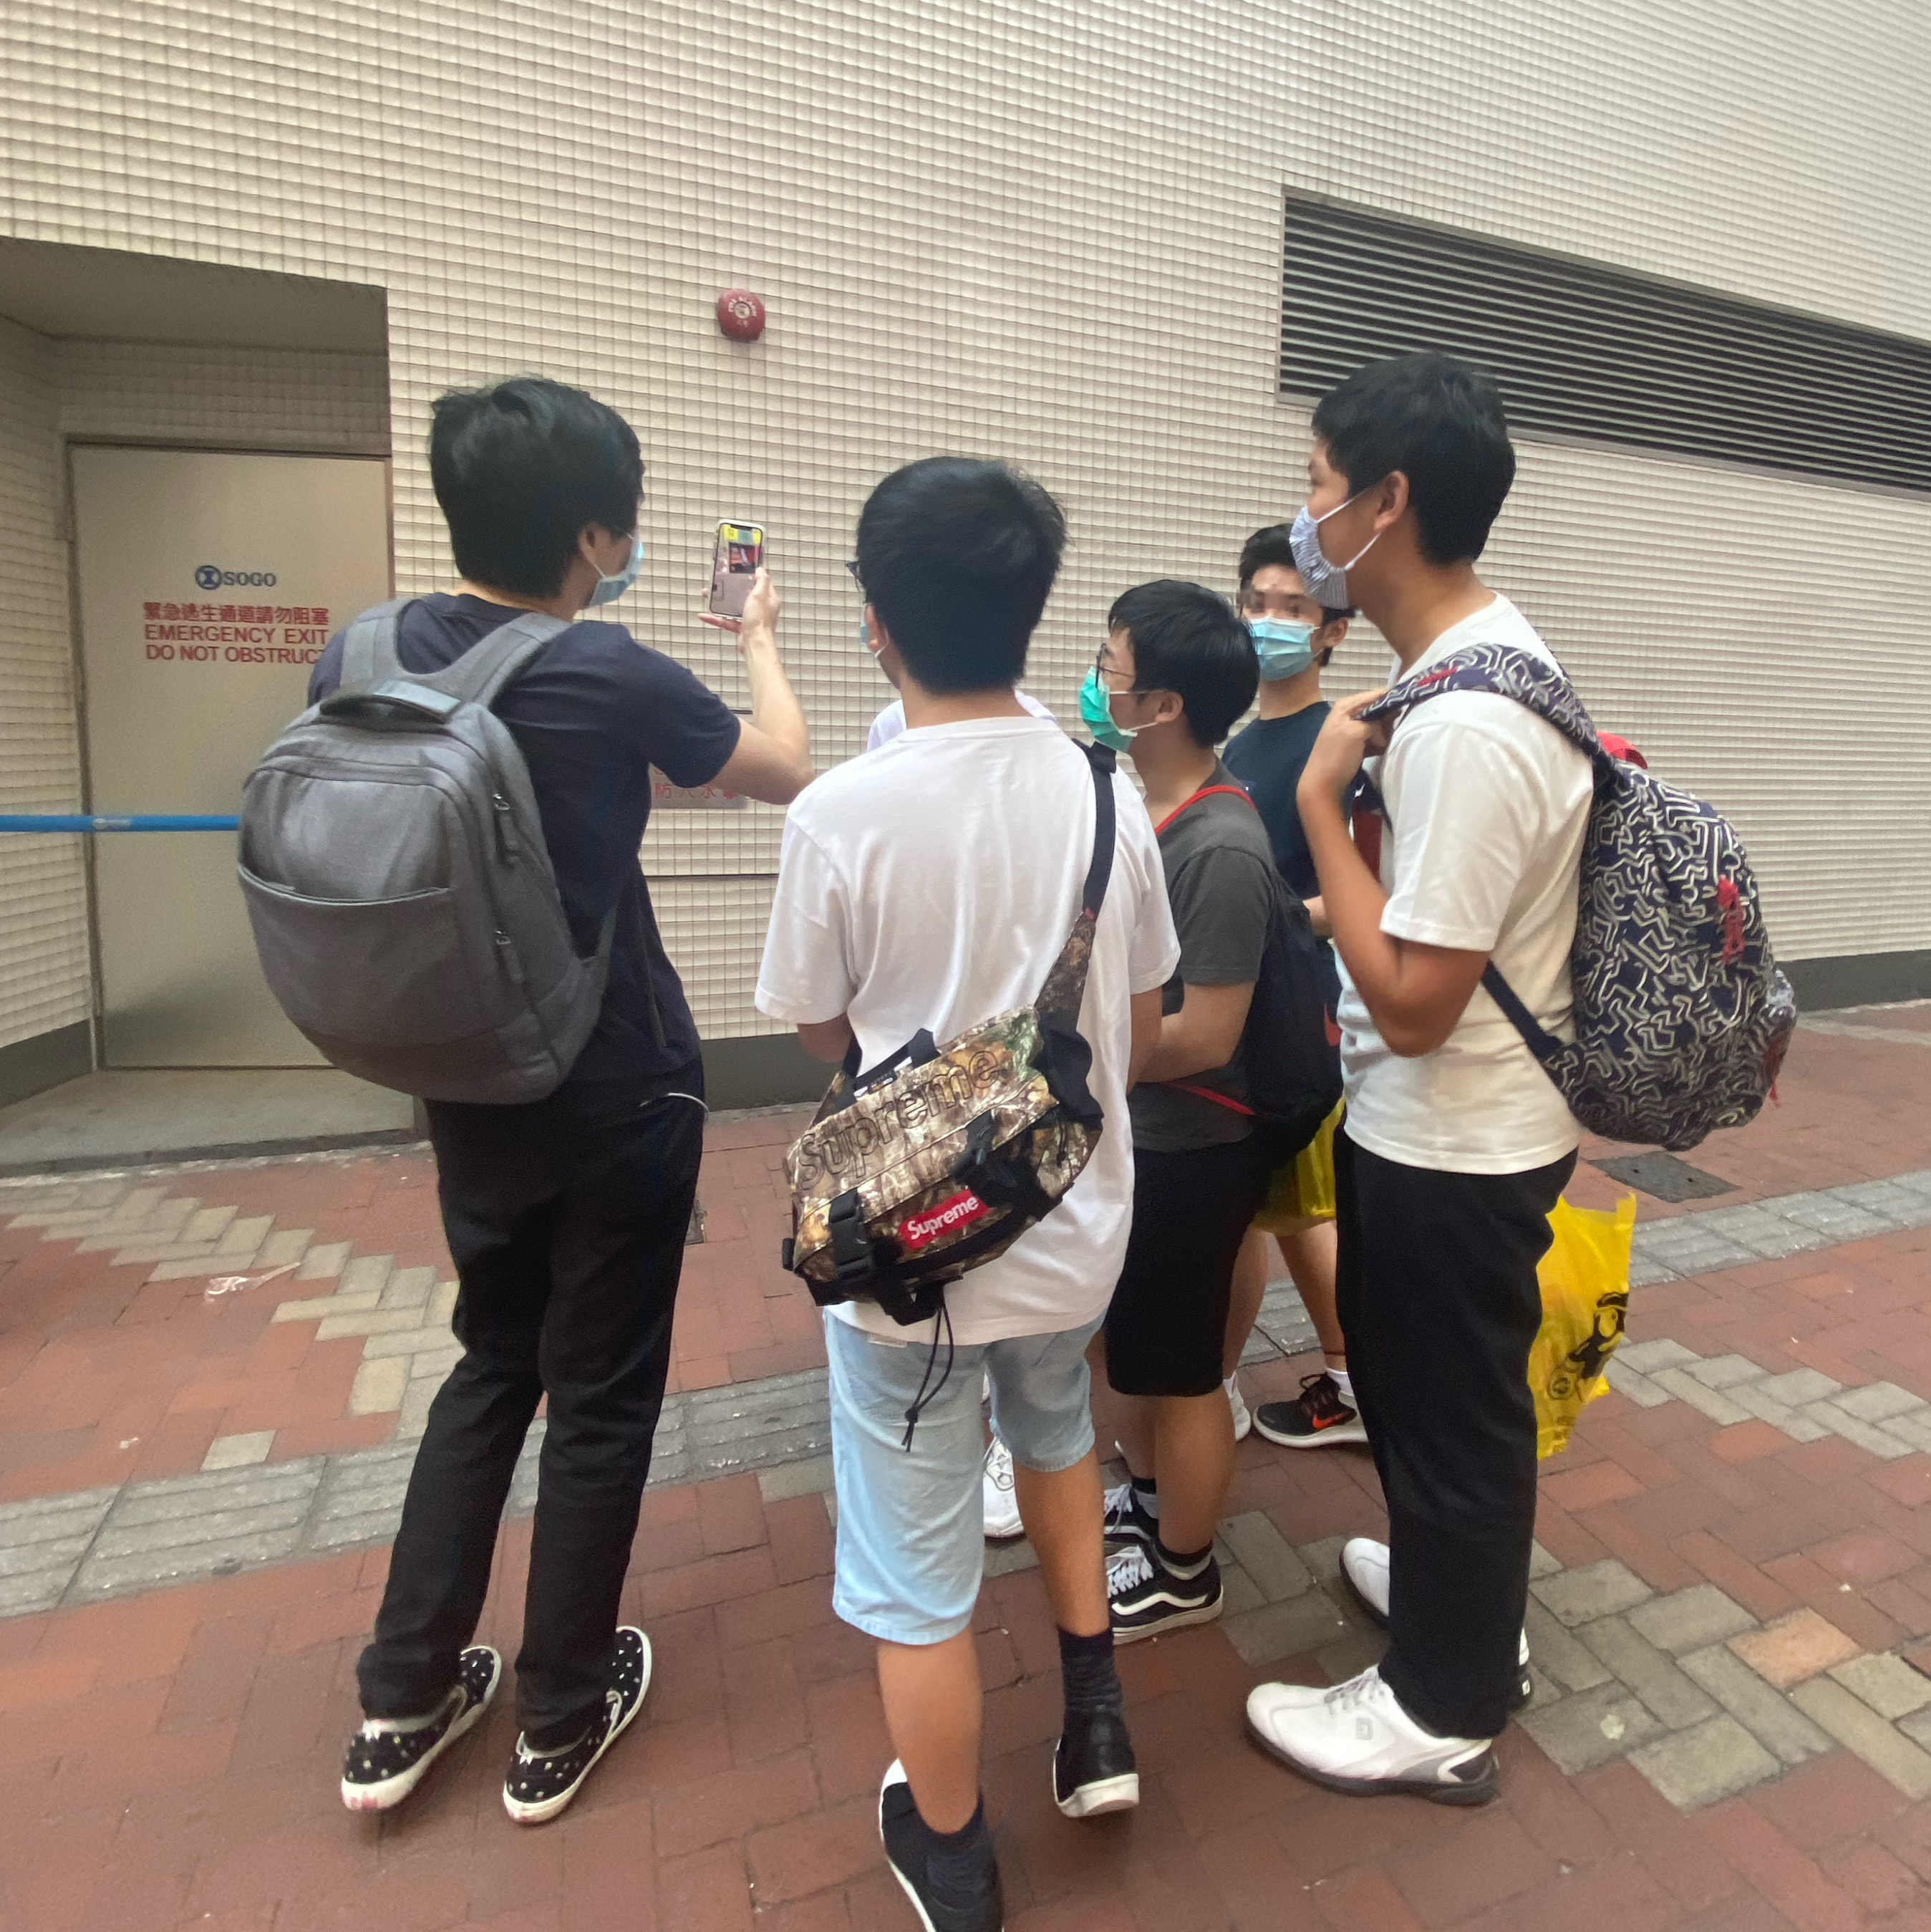
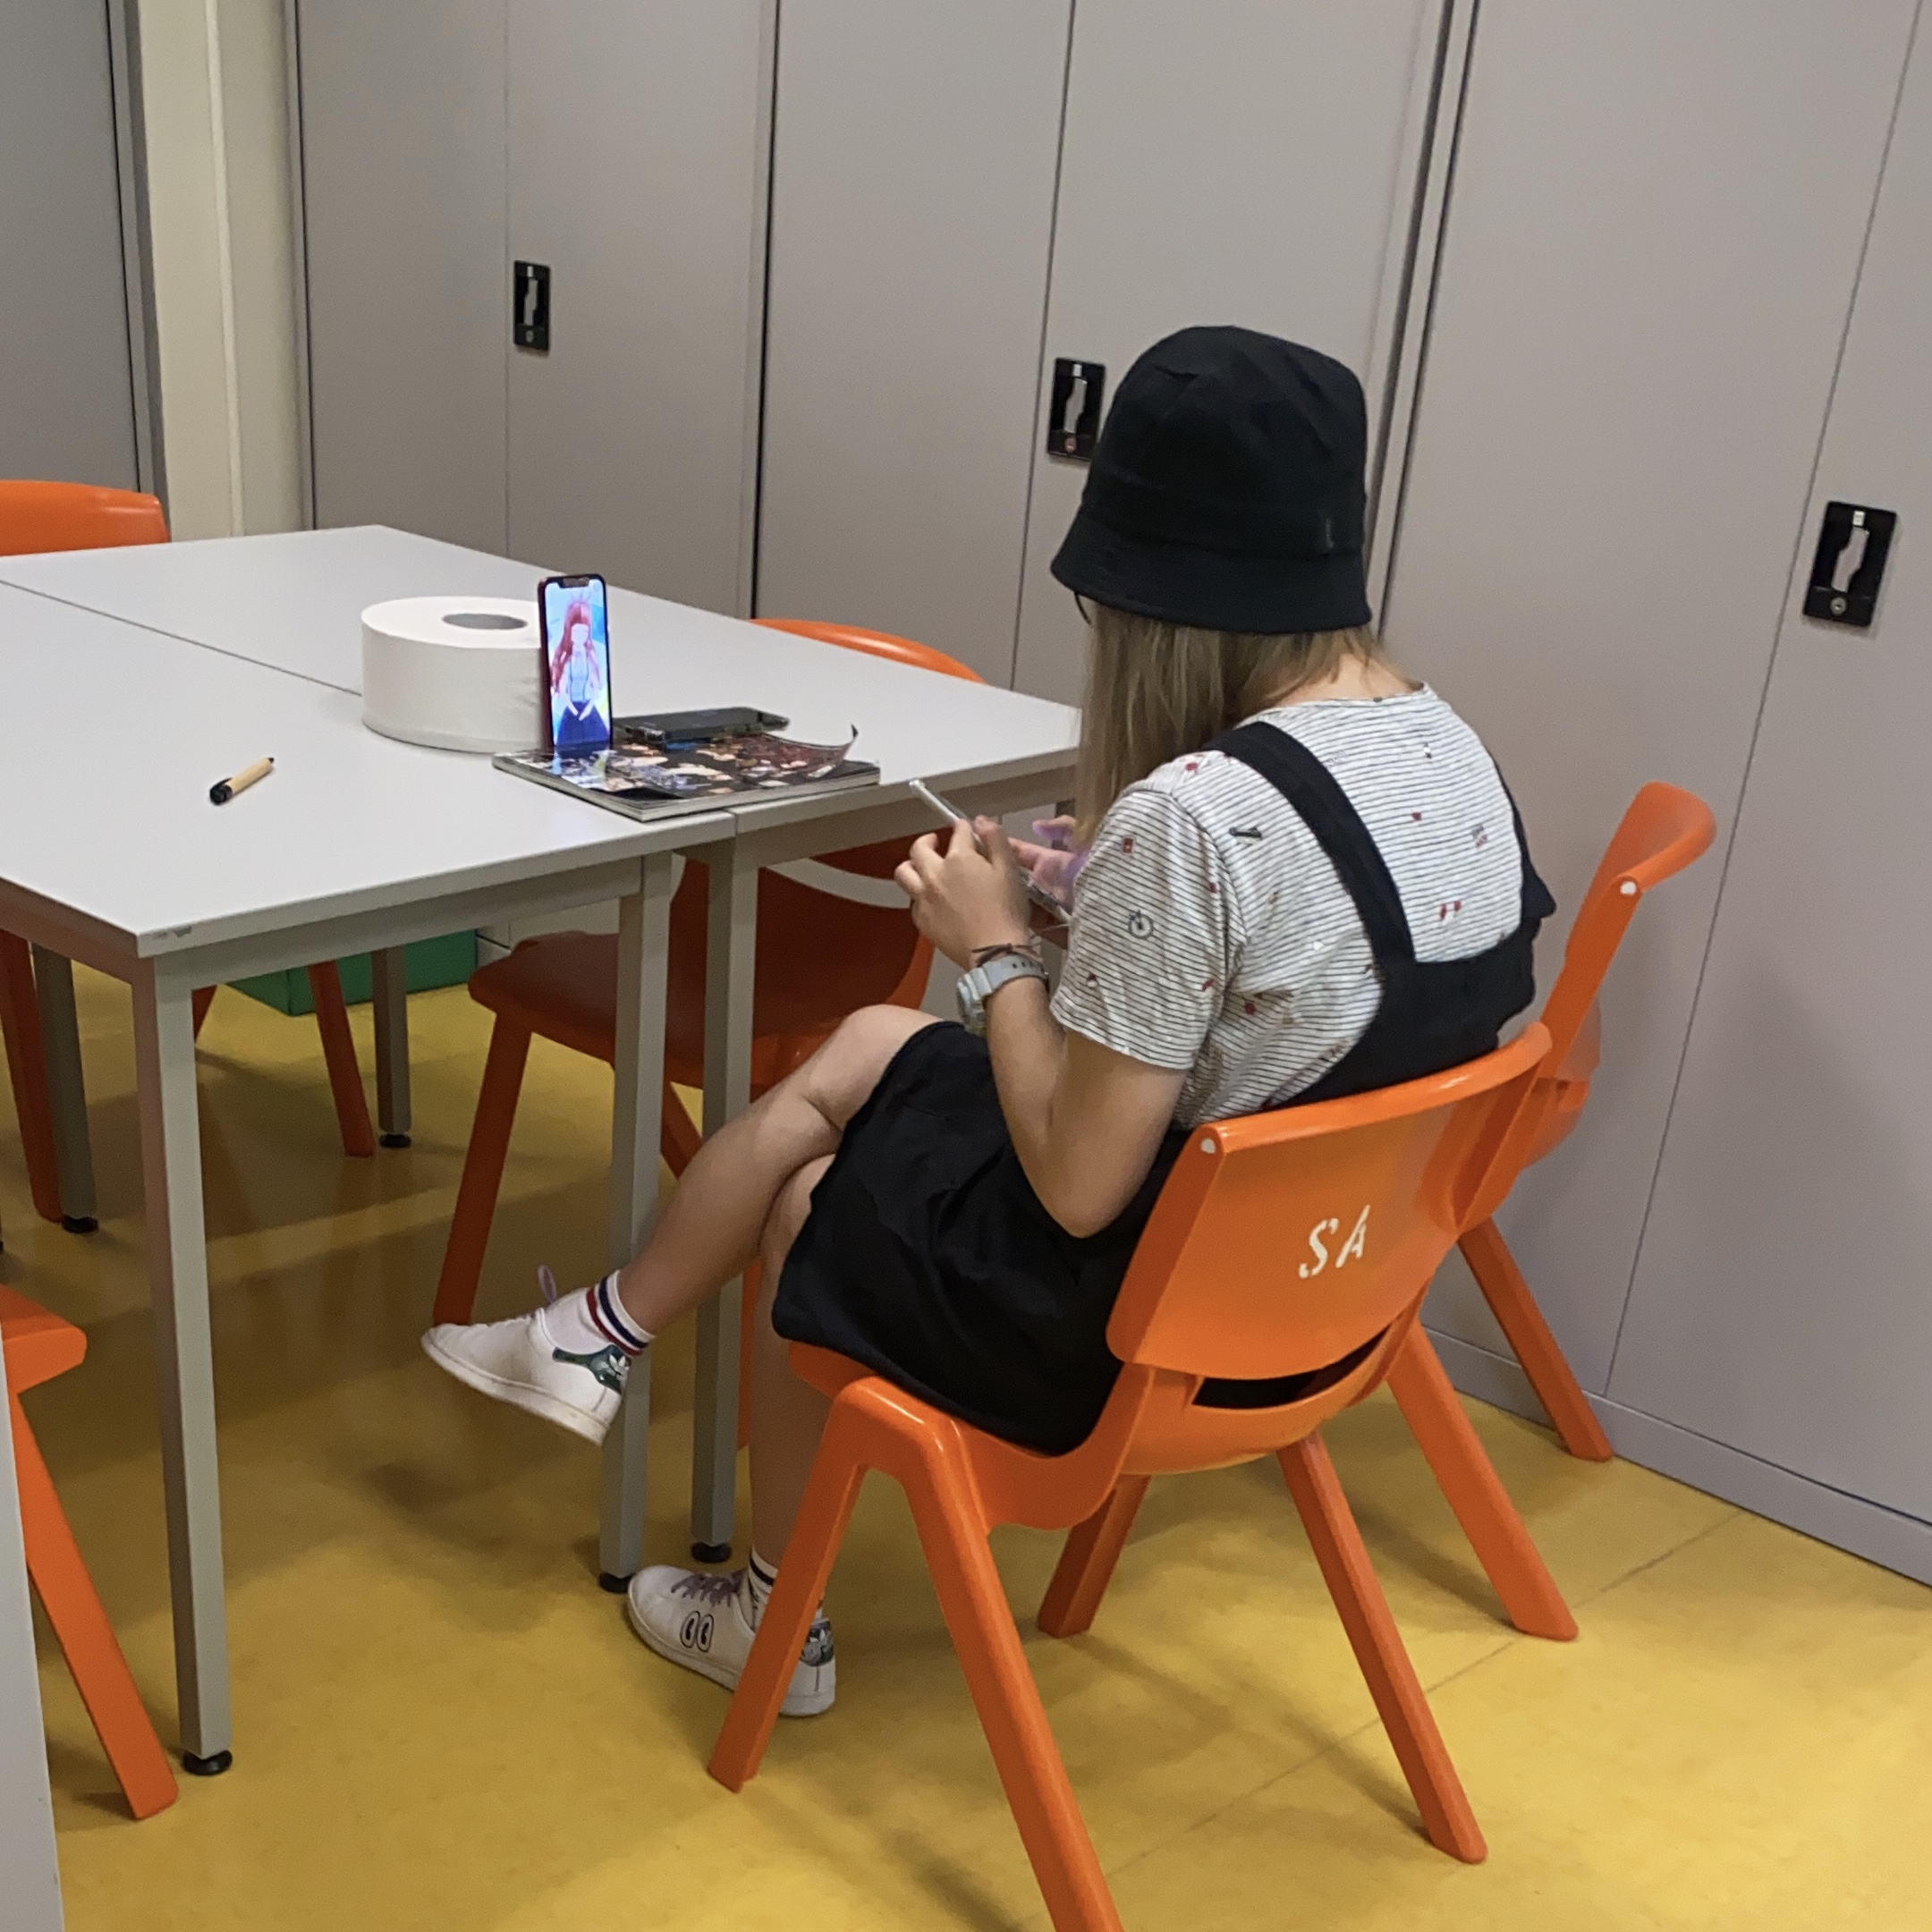
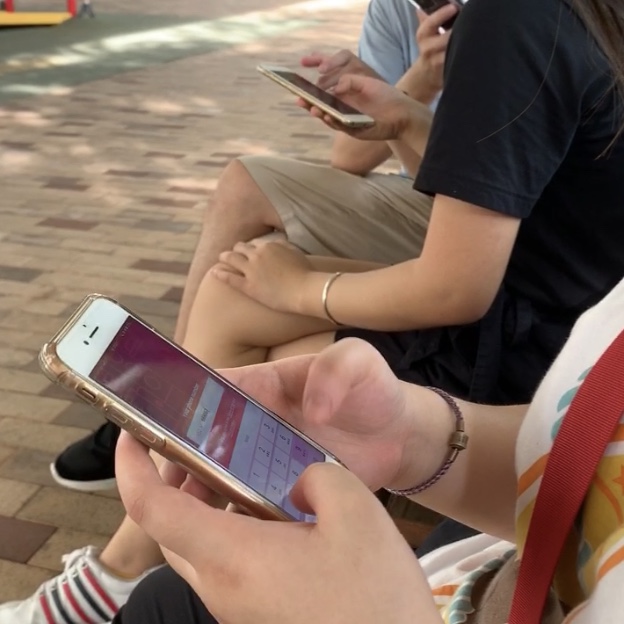
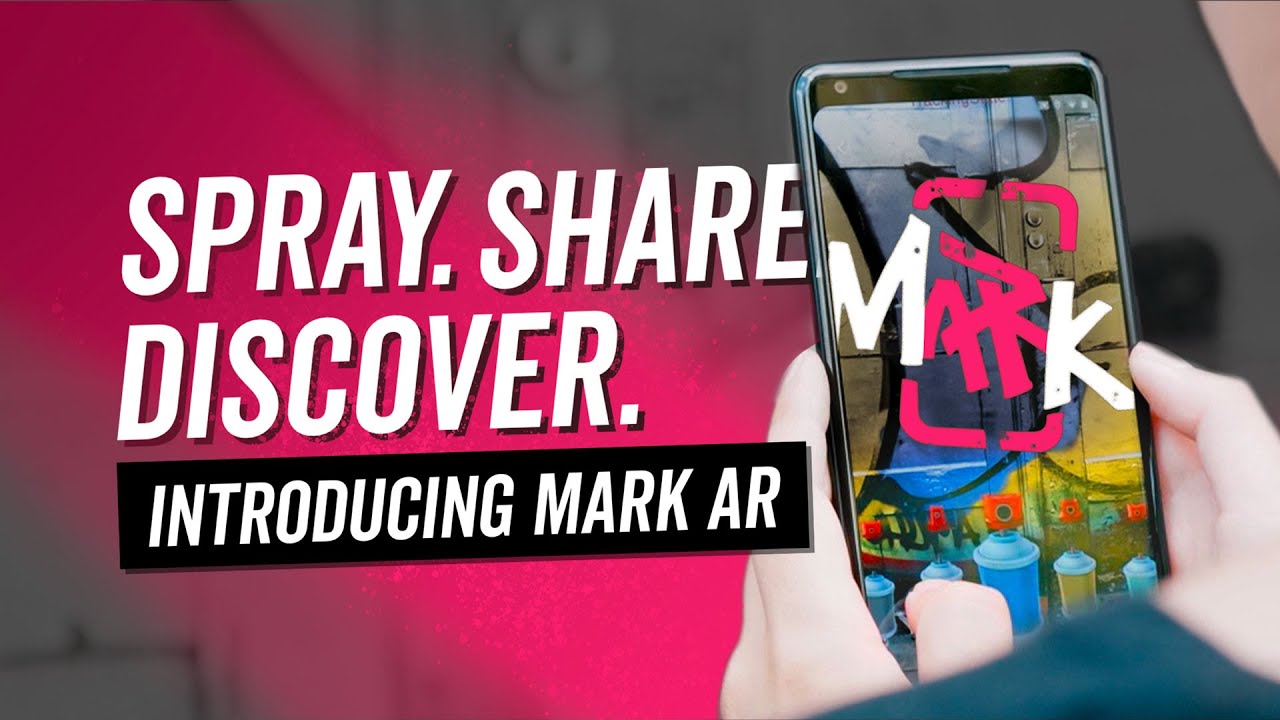
MARK AR in action — the social-location experience.
The product demo captures the core MARK interaction: discovering AR content placed at a physical location by another user. This is the experience that had to be demonstrated before sign-up — not just described in onboarding copy.
Impact
60%+ drop-off resolved. 4K downloads. Design Sprint embedded into team process.
Outcomes
- Onboarding drop-off resolved — demo-first redesign eliminated the primary conversion barrier
- 4K downloads recorded after the redesigned onboarding shipped
- Permission-context screens eliminated trust friction at each OS permission prompt
- Design System in Sketch: consistent output across UK AR and HK Native teams
- Centralised UI flow: reduced integration bugs from cross-team design inconsistencies
- Photo hint feature: resolved GPS precision gap in AR content discovery
- Design Sprint 2.0 embedded into team's ongoing product process
- Content testing data informed Sprint 2 strategy: content type, cultural considerations, creation vs. discovery balance
"In a location-based social platform, you cannot ask for social commitment before delivering social value. The onboarding must be the product experience — not a barrier to it."
Key design principle from the project